How to Read Balance Sheets Like a Professional Investor
In the world of investing, understanding a company’s financial health is crucial, and Balance Sheets serve as a vital tool in this analysis. By breaking down essential components like assets, liabilities, and shareholder equity, investors can gain clear insights into a company’s stability and performance. However, reading these documents isn’t as straightforward as it seems. This guide will walk you through the key metrics to analyze, how to interpret various elements, and common pitfalls to avoid, empowering you to read balance sheets like a seasoned investor. Get ready to elevate your financial literacy and make informed investment decisions with confidence!
Understanding the Balance Sheet Components
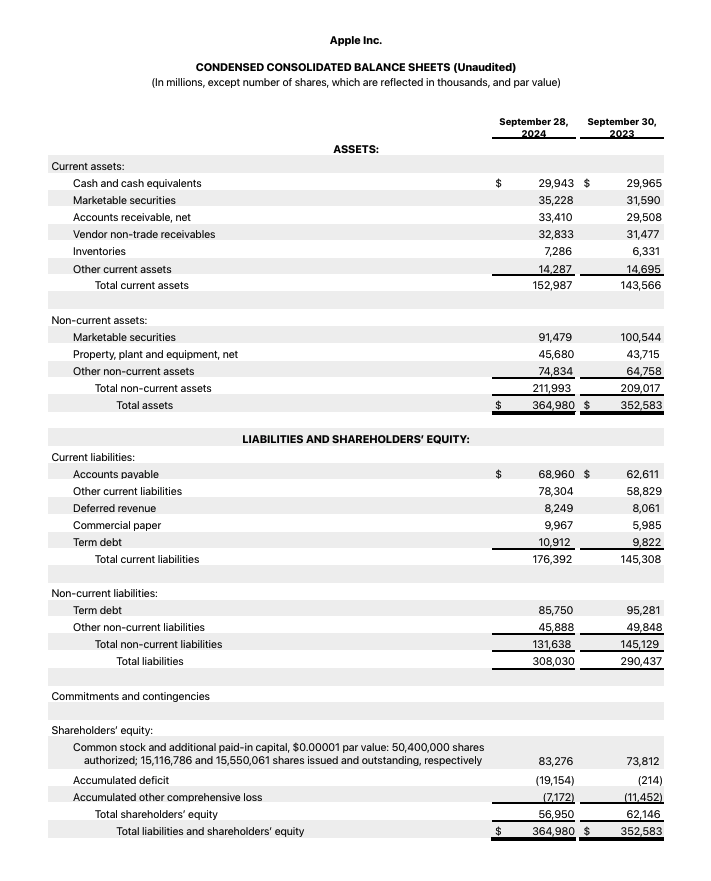
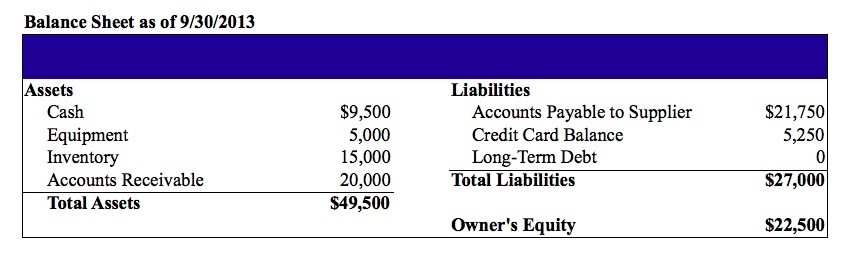
Reading Balance Sheets expertly starts with comprehending its primary components. Key elements provide a clear picture of a company’s financial health. Here’s a breakdown:
- Assets: Resources owned by the company, which can be classified into:
- Current Assets: Cash, accounts receivable, and inventory
- Non-Current Assets: Property, equipment, and intangible assets
- Liabilities: Obligations the company owes, divided into:
- Current Liabilities: Accounts payable, short-term debt
- Long-Term Liabilities: Bonds payable, long-term leases
- Shareholder Equity: Represents the owners’ claim on assets after liabilities are deducted. This includes:
- Common Stock: Equity raised from shareholders
- Retained Earnings: Profits reinvested in the business
| Component | Description |
|---|---|
| Assets | Resources owned by the company |
| Liabilities | Obligations owed by the company |
| Shareholder Equity | Owners’ claims on net assets after liabilities |
Understanding these components enables investors to better assess a company’s financial position and make informed investment decisions when analyzing Balance Sheets.
Key Metrics to Analyze on a Balance Sheet
Analyzing Balance Sheets is crucial for informed investment decisions. Here are some key metrics that professionals prioritize when evaluating a company’s financial health:
| Metric | Description |
|---|---|
| Current Ratio | Measures liquidity by comparing current assets to current liabilities. A ratio above 1 indicates adequate short-term financial health. |
| Debt-to-Equity Ratio | Assesses financial leverage by comparing total debt to shareholder equity. A lower ratio suggests less risk, while a higher ratio indicates higher risk exposure. |
| Return on Assets (ROA) | Indicates how effectively a company uses its assets to generate profit, calculated as net income divided by total assets. Higher values reflect better efficiency. |
| Working Capital | Represents the difference between current assets and current liabilities. Positive working capital indicates good short-term financial health. |
By focusing on these metrics, investors can gain insights into a company’s operational efficiency, risk levels, and overall financial stability, ultimately guiding investment choices.
How to Interpret Assets and Liabilities
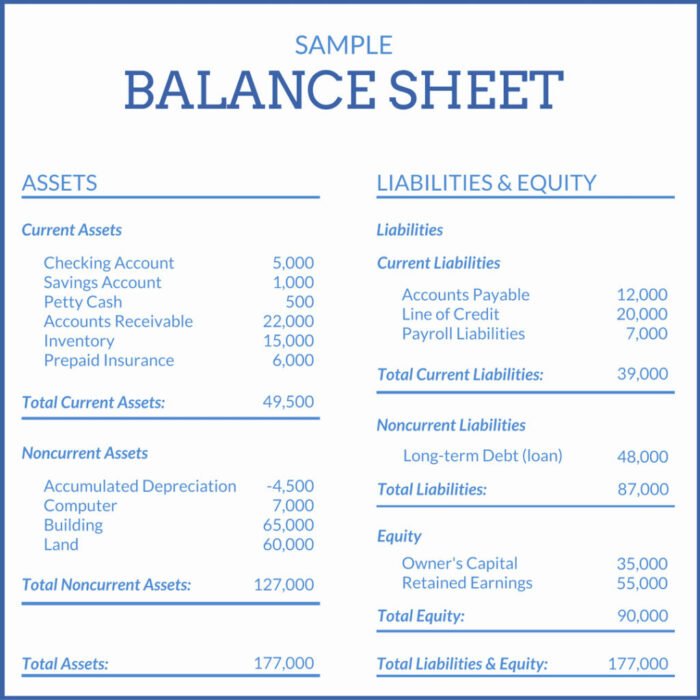
Interpreting Balance Sheets effectively requires a clear understanding of assets and liabilities. Assets represent what a company owns; they can be either current (convertible to cash within a year) or non-current (long-term investments). Key examples of current assets include cash and accounts receivable. In contrast, liabilities reflect what a company owes, divided into current liabilities (due within a year) and long-term liabilities.
| Category | Examples |
|---|---|
| Current Assets | Cash, Inventory, Accounts Receivable |
| Non-Current Assets | Property, Plant, Equipment, Intangibles |
| Current Liabilities | Accounts Payable, Short-Term Debt |
| Long-Term Liabilities | Bonds Payable, Long-Term Loans |
To interpret these components, assess the assets-to-liabilities ratio. A ratio above 1 indicates a financial cushion, suggesting stability. Conversely, a ratio below 1 may signal potential financial strain. By evaluating the composition of both assets and liabilities, investors can make informed decisions regarding a company’s financial health and risk potential. Understanding these elements is crucial in mastering how to read Balance Sheets effectively.
Evaluating Shareholder Equity
When assessing a company’s financial health, Balance Sheets play a crucial role, particularly the section dedicated to shareholder equity. This metric reveals how much worth is attributed to the company’s shareholders and indicates its financial stability. Here’s how to evaluate shareholder equity effectively:
- Understanding Components:
- Common Stock: Represents ownership and direct investment.
- Retained Earnings: Profits not distributed as dividends, indicating a company’s reinvestment strategy.
- Additional Paid-In Capital: Excess paid by investors above the nominal value of stock.
| Metric | Description | What It Indicates |
|---|---|---|
| Total Equity | Sum of all equity components | Overall value attributable to shareholders |
| Return on Equity (ROE) | Net income divided by total equity | Profitability relative to shareholder investment |
| Equity-to-Assets Ratio | Total equity divided by total assets | Financial leverage and stability |
By focusing on these elements, investors can gauge not only the resilience of a company but also its potential for growth and return on investment. Remember, strong shareholder equity suggests a solid foundation, while weak metrics may prompt further scrutiny.
Common Pitfalls to Avoid When Reading Balance Sheets
When diving into Balance Sheets, it’s crucial to be mindful of certain common pitfalls that could mislead your analysis. Here are key points to consider:
| Pitfall | Description |
|---|---|
| Ignoring Context | Always assess the Balance Sheet in conjunction with income statements and cash flow statements for a holistic view. |
| Overlooking Notes | Financial statements are often accompanied by notes; these provide essential context and should not be neglected. |
| Misunderstanding Assets | Different types of assets (current vs. non-current) can skew your understanding of liquidity and operational efficiency. |
| Focusing Solely on Overflowing Assets | A high asset volume does not always signify strength; consider liabilities and equity for a balanced perspective. |
| Neglecting Trends | Always compare historical data to evaluate performance over time rather than just static figures. |
By being aware of these pitfalls, you can enhance your financial analysis and investment decisions. Remember, a thorough understanding of a company’s Balance Sheet is key to your success as an investor.
Tips for Comparing Balance Sheets Across Companies
Comparing Balance Sheets across companies can provide valuable insights but requires a methodical approach. First and foremost, ensure that the companies belong to the same industry. This relevance allows for context; for example, tech companies often have significant intangible assets and different capital structures compared to manufacturing firms.
Next, consider using a standardized format for comparison. This includes focusing on key metrics like current ratio, debt-to-equity ratio, and return on equity. Creating a comparison table can simplify the evaluation process, highlighting differences and similarities in financial health:
| Metric | Company A | Company B |
|---|---|---|
| Current Ratio | 2.5 | 1.8 |
| Debt-to-Equity Ratio | 0.4 | 0.7 |
| Return on Equity | 12% | 15% |
Additionally, adjust for differences in company size. A larger company may have a more stable Balance Sheet, often making it easier to handle fluctuations. Finally, stay updated on economic conditions and regulatory environments that may influence companies similarly, allowing for a more nuanced understanding of their financial positions.
By applying these tips, investors can attain a deeper comprehension of financial data and make informed decisions based on comparative analysis.
Frequently Asked Questions
What is a balance sheet and why is it important for investors?
A balance sheet is a financial statement that provides a snapshot of a company’s financial position at a specific point in time, listing its assets, liabilities, and shareholders’ equity. For investors, it serves as a critical tool for assessing a company’s financial health, determining its leverage, and understanding its ability to meet short-term and long-term obligations. By analyzing a balance sheet, investors can make informed decisions about potential investments and gauge the overall stability of the company.
What key components should I look for when analyzing a balance sheet?
When analyzing a balance sheet, key components to focus on include total assets, total liabilities, and shareholders’ equity. Within assets, it’s crucial to differentiate between current assets (cash, inventory, receivables) and non-current assets (property, plant, equipment). Pay attention to the current ratio, which compares current assets to current liabilities, indicating liquidity. Additionally, the debt-to-equity ratio is significant as it shows the proportion of debt used in financing; a higher ratio may indicate greater financial risk.
How do I interpret debt levels on a balance sheet?
Interpreting debt levels on a balance sheet involves examining both the absolute dollar amount of liabilities and the ratios that indicate how those liabilities relate to equity. A higher total debt might suggest a company is using leverage to fuel growth, but it poses risks if debt levels exceed manageable limits. The debt-to-equity ratio helps in assessing this balance; a lower ratio indicates less risk, while a higher ratio could signal potential difficulty in meeting obligations, especially in downturns.
What are some common mistakes to avoid when reading a balance sheet?
Common mistakes when reading a balance sheet include overlooking the distinction between current and long-term assets and liabilities, which can obscure liquidity issues. Investors often fail to consider off-balance-sheet liabilities, such as leases or contingent liabilities, which can significantly impact a company’s financial health. Additionally, taking numbers at face value without considering the context of industry benchmarks can lead to misinterpretation. It’s essential to analyze trends over multiple periods to gain a clearer understanding of financial stability.