What Is Technical Analysis? Candlestick Patterns Explained for Beginners
In the fast-paced world of financial markets, understanding the nuances of investing can be the key to successful trading. One essential tool that traders often rely on is Technical Analysis, which helps them decipher market trends and make informed decisions. Among the various methods of technical analysis, candlestick patterns stand out as a powerful resource for beginners looking to gain insights into price movements. This blog post will guide you through the fundamentals of technical analysis, explain the significance of candlestick patterns, and equip you with the knowledge to interpret these patterns effectively for better trading outcomes. Whether you’re just starting your trading journey or looking to refine your skills, understanding these concepts will enable you to navigate the complexities of the market with confidence.
Understanding Technical Analysis in Financial Markets
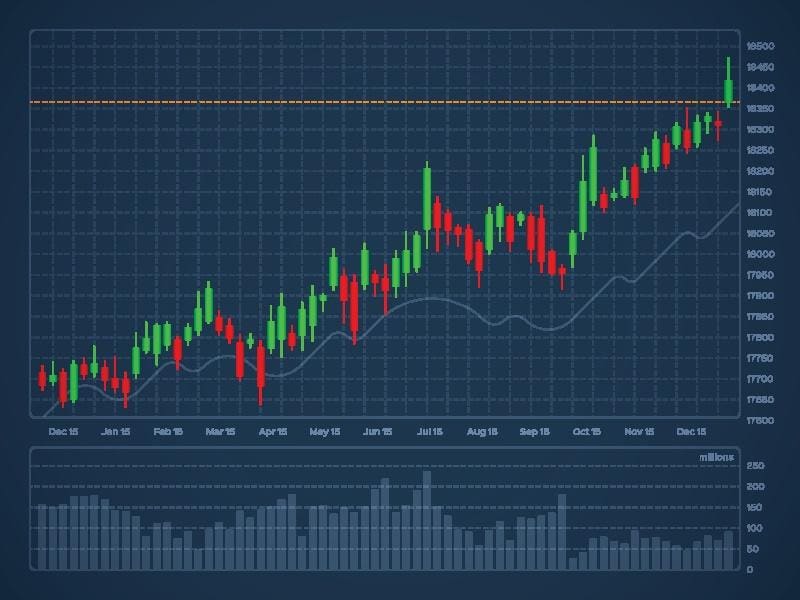
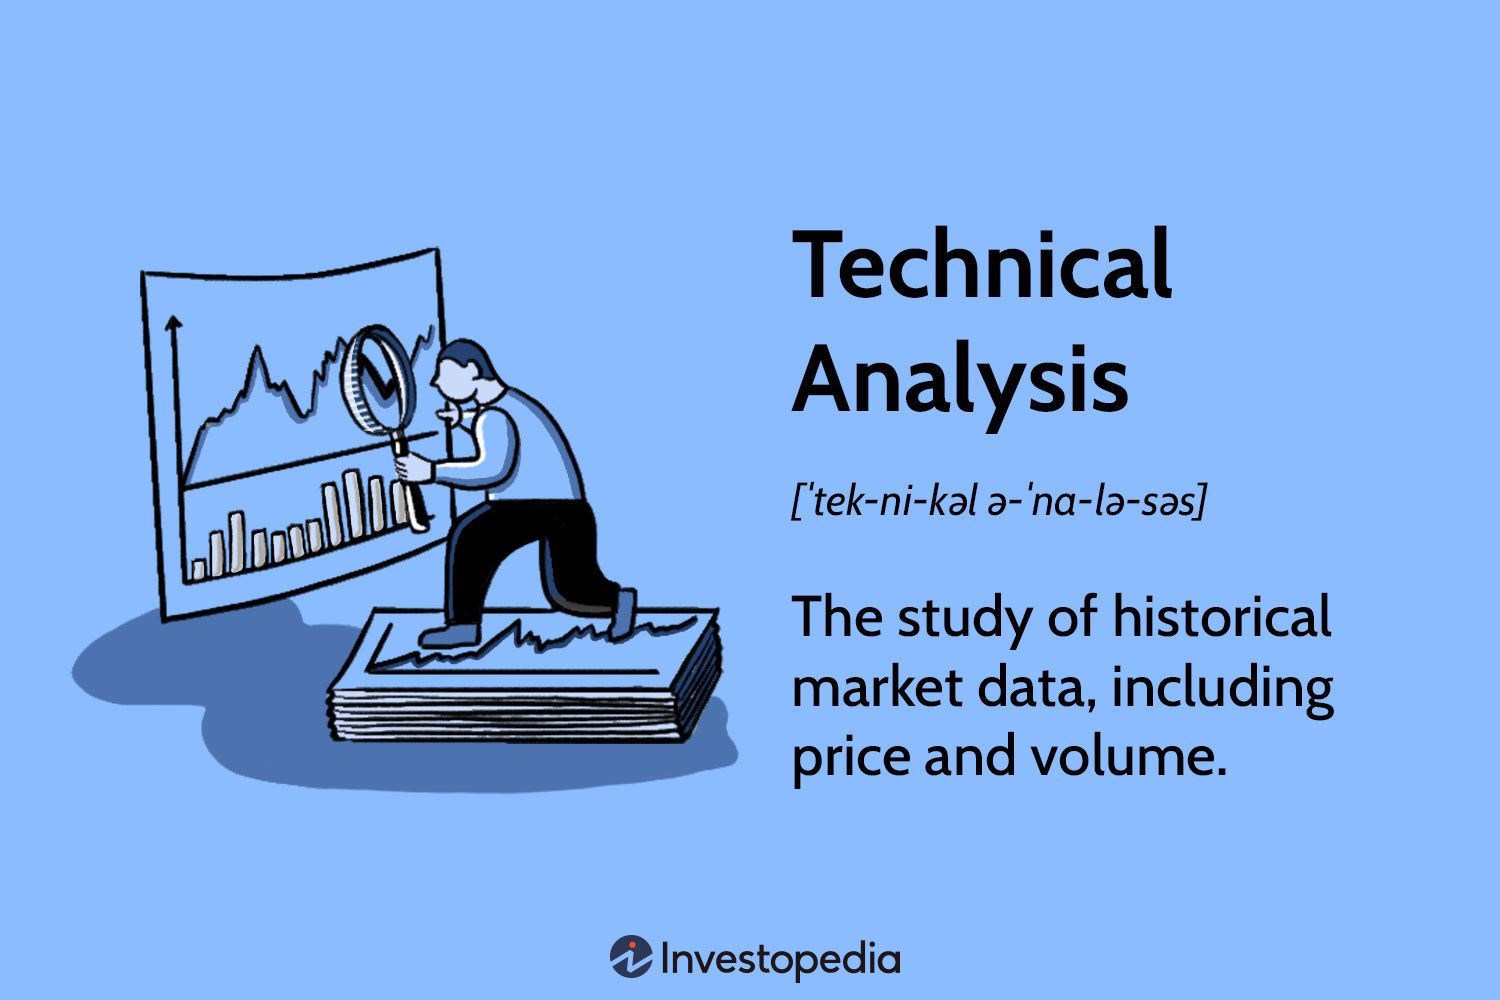
Technical Analysis is a method used by traders to evaluate securities through statistical trends gathered from trading activity. By focusing on historical price movements and trading volume, market participants can make educated predictions about future price behavior. Here are some key components:
- Price Charts: Provide a visual representation of price movements over specific periods.
- Volume Analysis: Studies the amount of shares traded, helping investors gauge interest in a security.
- Indicators and Tools: Utilize various formulas, such as Moving Averages and Relative Strength Index (RSI), to assess market trends.
| Aspect | Description |
|---|---|
| Objective | Predict future price movements based on past data. |
| Timeframes | Can be applied to minutes, hours, days, or weeks. |
| Market Sentiment | Captures traders’ feelings and attitudes towards assets. |
| Strategy Integration | Complements other strategies like Fundamental Analysis. |
With this approach, traders can identify entry and exit points, enhancing their trading outcomes in the ever-changing financial markets.
The Importance of Candlestick Patterns in Technical Analysis
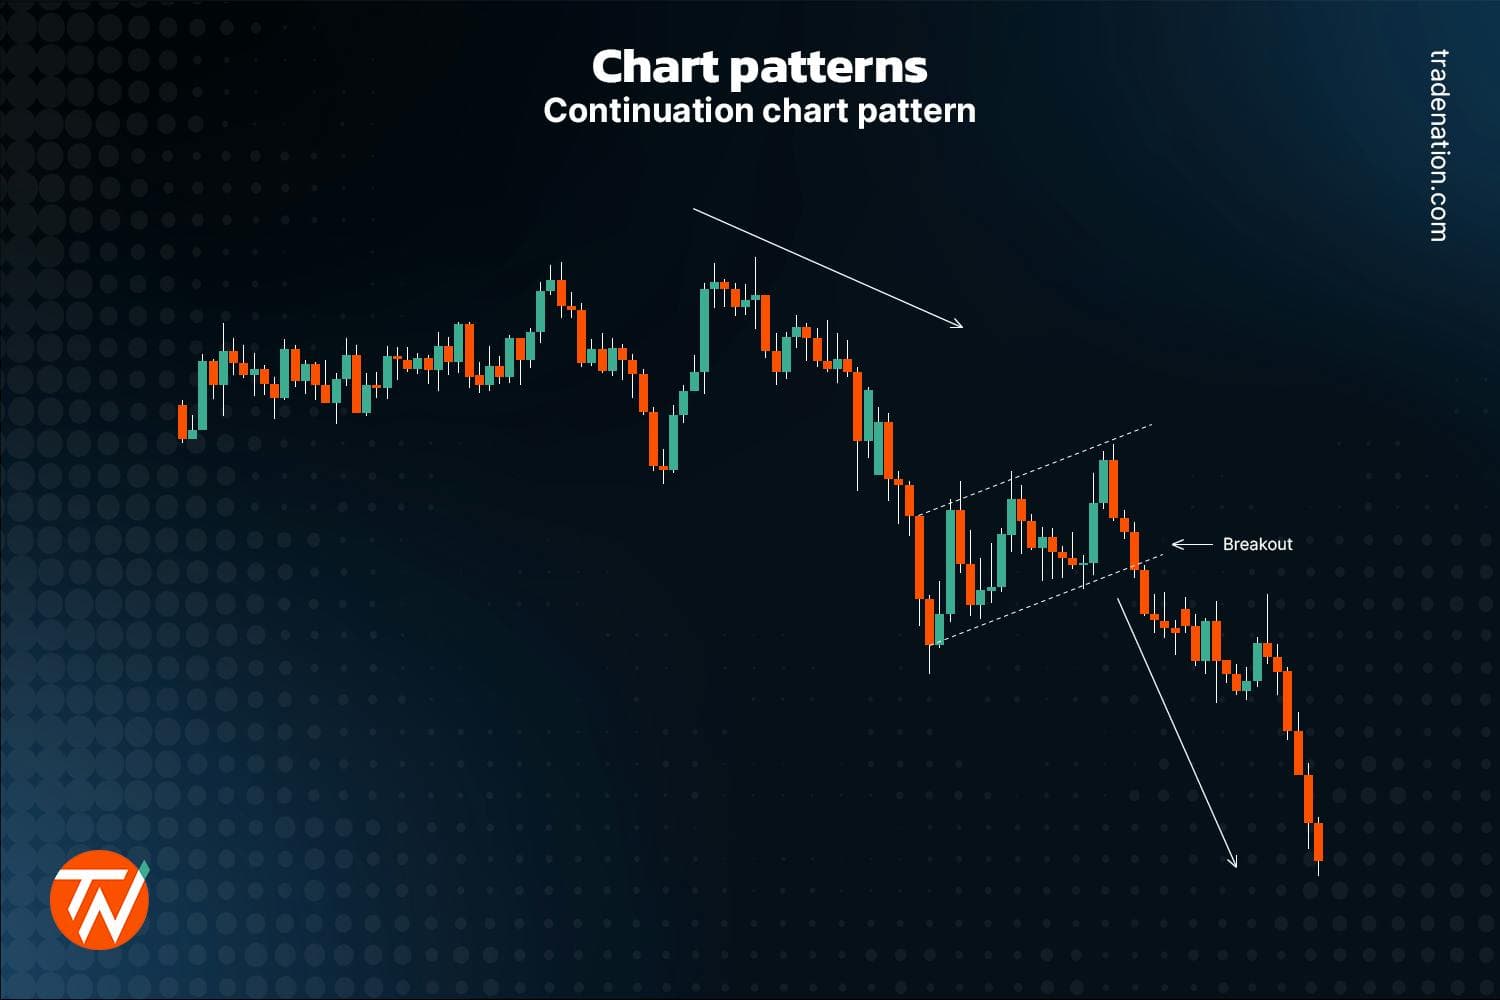
Candlestick patterns serve as crucial indicators in Technical Analysis, helping traders visualize market movements and sentiment. Understanding these patterns allows beginners to make informed decisions. Here are some key reasons highlighting their importance:
| Key Point | Explanation |
|---|---|
| Market Sentiment | Candlestick patterns reflect investor emotions, signaling bullish or bearish trends. |
| Trend Reversal Indicators | Certain formations can indicate potential reversals, enabling timely trade decisions. |
| Entry and Exit Points | Patterns can reveal optimal moments for entering or exiting trades, maximizing profits. |
| Confirmation Signals | Patterns often work in tandem with other indicators, confirming trade signals for greater accuracy. |
By mastering candlestick patterns, traders can enhance their Technical Analysis skills and participate more effectively in financial markets.
Basic Candlestick Patterns Every Beginner Should Know
Understanding Technical Analysis involves recognizing various candlestick patterns that can signal market movements. Here are some fundamental patterns every beginner should be familiar with:
1. Doji: This pattern appears when the opening and closing prices are virtually the same. A Doji indicates indecision in the market, which may lead to a trend reversal.
2. Hammer: A Hammer forms after a price decline and has a small body with a long lower shadow. This pattern suggests a potential bullish reversal, signaling buyers are stepping in.
3. Engulfing: The Bullish Engulfing occurs when a smaller bearish candle is followed by a larger bullish candle that “engulfs” it. This indicates strong buying momentum and possible trend reversal.
4. Shooting Star: Opposite to the Hammer, a Shooting Star forms after an uptrend, featuring a small body with a long upper shadow. This pattern may signify a bearish reversal, warning traders to be cautious.
| Pattern | Description | Signal |
|---|---|---|
| Doji | Small body, equal open/close | Indecision/Trend Reversal |
| Hammer | Small body, long lower shadow | Bullish Reversal |
| Engulfing | Larger bullish candle follows smaller bearish | Bullish Momentum |
| Shooting Star | Small body, long upper shadow | Bearish Reversal |
By mastering these basic candlestick patterns, beginners can improve their Technical Analysis skills, enhancing their trading strategies and decision-making processes.
Interpreting Candlestick Patterns for Trading Decisions
Understanding how to interpret candlestick patterns is crucial for making informed trading decisions. Traders often rely on these visual cues to gauge market sentiment and predict future price movements. Here are some insights into interpreting candlestick patterns effectively:
- Recognizing Patterns: Familiarize yourself with common patterns such as Doji, Hammer, and Engulfing. Each pattern signals potential market reversals or continuations.
- Analyzing Context: Evaluate candlestick patterns in the context of the broader market trend. A bullish pattern in a bearish market may warrant caution.
- Volume Confirmation: Always consider trading volume alongside candlestick patterns. A pattern accompanied by high volume tends to be more reliable.
| Pattern Type | Description | Signal |
|---|---|---|
| Doji | Open and close are nearly equal | Market indecision |
| Hammer | Small body with long lower wick | Potential bullish reversal |
| Engulfing | Larger candle engulfs the previous | Reversal indication |
Utilizing Technical Analysis effectively involves not just spotting these patterns, but also interpreting their meaning within the trading landscape. By synthesizing price action and volume, traders can make better-informed decisions and enhance their trading strategy.
Common Mistakes in Technical Analysis for Beginners
Navigating the world of Technical Analysis can be challenging for beginners. Here are some common pitfalls to avoid:
| Mistake | Description |
|---|---|
| Over-reliance on Indicators | Many beginners trust indicators blindly, ignoring market context and trends. |
| Ignoring Market News | Failing to consider macroeconomic factors can distort analysis and lead to losses. |
| Inconsistent Strategy | Lack of a defined trading plan often results in erratic decisions and poor outcomes. |
| Overtrading | Getting caught in the excitement leads to excessive trades, increasing risk. |
| Neglecting Risk Management | Some beginners overlook stop-loss orders, exposing themselves to significant losses. |
By recognizing these mistakes, beginner traders can refine their approach and enhance their understanding of Technical Analysis. Developing a disciplined mindset and incorporating a balanced strategy is key to success in trading.
Integrating Technical Analysis with Other Trading Strategies
Integrating Technical Analysis with other trading strategies can significantly enhance your trading success. By combining different methodologies, traders can develop a more comprehensive approach. Here are a few effective strategies to consider:
| Trading Strategy | Integration Benefit |
|---|---|
| Trend Following | Aligns with indicators from Technical Analysis to confirm market momentum. |
| Fundamental Analysis | Provides context to the numbers seen in charts, allowing for better-informed decisions. |
| Risk Management Strategies | Ensures that entry and exit points are backed by Technical Analysis to minimize losses. |
| Sentiment Analysis | Allows traders to gauge market emotions and expectations alongside technical signals. |
Using these strategies together empowers traders to make more informed decisions. For instance, while Technical Analysis can reveal entry and exit points, adding a layer of fundamental analysis or sentiment can provide a better understanding of market trends. Therefore, it’s essential to remain adaptable and integrate these strategies for a more robust trading plan.
Frequently Asked Questions
What is technical analysis and why is it important for traders?
Technical analysis is a method used to evaluate and forecast the future price movements of an asset by analyzing historical price charts and market stats, primarily focusing on price patterns, volume, and various indicators. For traders, this approach is vital as it assists in identifying potential buying or selling opportunities based on key signals derived from past performance. This helps traders make informed decisions to optimize their trading strategies and improve their chances of generating profitable outcomes.
What are candlestick patterns and how can they be interpreted?
Candlestick patterns are graphical representations of price movements over a specified period and are fundamental to technical analysis. Each ‘candlestick’ has a body that indicates the opening and closing prices, with wicks showing the highest and lowest prices during that time frame. By analyzing these patterns, traders can interpret market sentiment and potential reversal or continuation points. Patterns such as dojis, hammers, and engulfing patterns provide insights on market trends, enabling traders to anticipate future price movements.
Who can benefit from learning candlestick patterns?
Learning candlestick patterns can benefit a wide range of individuals involved in trading and investing, including novice traders, seasoned investors, and even financial analysts. Beginners can use these patterns as foundational tools to understand market behavior, while experienced traders can refine their strategies and react swiftly to market changes. Additionally, those interested in stock trading, forex, or cryptocurrency trading will find value in mastering these patterns to enhance their decision-making process and potentially increase profits.
Are candlestick patterns reliable indicators for trading decisions?
While candlestick patterns are widely used among traders as indicators of potential market movements, they are not infallible. Their reliability can depend on various factors, such as market context, volume, and concurrent technical indicators. It’s crucial for traders to combine candlestick analysis with other analytical tools and risk management strategies for more effective trading outcomes. Therefore, while these patterns can provide valuable insights, they should not be solely relied upon for trading decisions.