How to Perform Stock Market Analysis Using Free Tools and Data
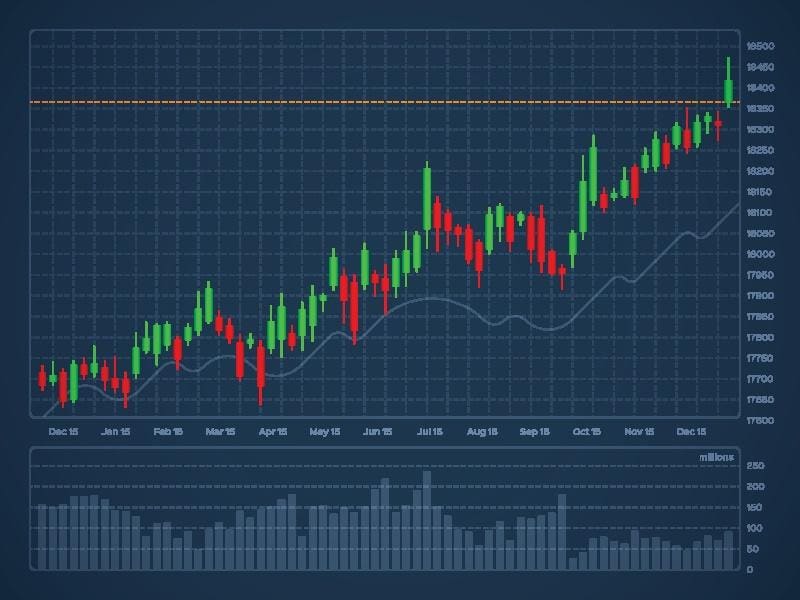
Navigating the stock market can often feel overwhelming, especially for beginners eager to make informed investment decisions. Fortunately, performing Stock Market Analysis doesn’t have to come with a hefty price tag. In this guide, we will explore essential free tools and publicly available data that empower you to conduct thorough analyses without breaking the bank. From understanding the basics and leveraging technical techniques to interpreting market trends, we aim to equip every aspiring investor with the knowledge and resources needed to confidently step into the world of stock trading. Whether you’re just starting out or looking to refine your skills, our comprehensive approach will unlock the potential of free resources at your fingertips.
Understanding the Basics of Stock Market Analysis
To navigate the stock market successfully, it’s crucial to grasp foundational concepts. Here are some key elements to consider:
- Definition: Stock market analysis involves evaluating financial data, market trends, and various indicators to make informed investment decisions.
- Types of Analysis:
- Technical Analysis: Focuses on price movements and trading volumes using charts.
- Fundamental Analysis: Assesses a company’s financial health through earnings, revenue, and economic factors.
| Aspect | Technical Analysis | Fundamental Analysis |
|---|---|---|
| Focus | Price patterns and trends | Company performance and value |
| Tools | Charts, graphs, indicators | Financial statements, news |
| Timeframe | Short-term trading | Long-term investment strategies |
- Importance: Understanding these aspects helps investors identify opportunities and mitigate risks, ultimately leading to more strategic portfolio management. Grasping the basics lays the groundwork for utilizing free tools and resources effectively.

Essential Free Tools for Stock Market Analysis
Navigating the stock market doesn’t have to break the bank. Numerous free tools provide valuable insights for traders and investors. Here are some of the most essential resources:
| Tool | Purpose | Key Features |
|---|---|---|
| Yahoo Finance | Market tracking | Real-time quotes, news, portfolio management |
| Google Finance | Stock monitoring | Alerts, charts, and financial news |
| TradingView | Technical analysis | Interactive charts, social community features |
| Investopedia | Educational resources | Guides on terminology, strategies, and concepts |
| Finviz | Screening and filtering stocks | Stock screener, heat maps, and financial visuals |
Utilizing these tools enables you to build a solid foundation in market trends and stock performance. By integrating these free resources into your daily routine, you can streamline your investment decisions and gain a competitive edge.
Utilizing Publicly Available Financial Data
Utilizing publicly available financial data is a cornerstone of effective stock market analysis. Accessing credible and detailed information about companies helps investors make informed decisions. Here are some key sources to consider:
| Source | Description | Pros | Cons |
|---|---|---|---|
| Yahoo Finance | Offers stock quotes, news, and historical data. | User-friendly interface | Limited advanced analytics |
| Google Finance | Provides financial summaries and market trends. | Integrates well with Google tools | Not as comprehensive |
| SEC EDGAR Database | Contains official filings from public companies. | Highly authoritative | Can be overwhelming for newbies |
| Morningstar | Delivers detailed analysis and ratings. | Rich data and insights | Some features require payment |
By leveraging these resources, you can gather essential metrics such as earnings reports, balance sheets, and cash flow statements at no cost. Therefore, incorporating these insights into your Stock Market Analysis enables you to spot trends, gauge a company’s performance, and inform your investment strategy effectively. Always remember to cross-reference the data to ensure its reliability.
Technical Analysis Techniques Using Free Resources
Technical analysis is an essential aspect of Stock Market Analysis that allows traders to forecast future price movements based on historical data. Here are some effective techniques you can implement using free resources:
- Chart Patterns: Recognizing patterns like head and shoulders or flags can signal potential price movements.
- Indicators and Oscillators:
- Moving Averages: Helps smooth price data to identify trends.
- Relative Strength Index (RSI): Measures speed and change of price movements to identify overbought or oversold conditions.
| Technique | Description | Free Resources |
|---|---|---|
| Support and Resistance Levels | Identifies price levels where stocks often reverse. | TradingView, StockCharts |
| Fibonacci Retracement | Used to identify potential reversal levels based on Fibonacci ratios. | Investopedia, Yahoo Finance |
| Volume Analysis | Examines the trading volume to validate trends. | MarketWatch, Finviz |
Utilizing these techniques is crucial for maximizing your trading strategies without incurring costs. Free platforms provide abundant resources to help you master these techniques, making Stock Market Analysis accessible to everyone.

Fundamental Analysis for Beginners with No Cost
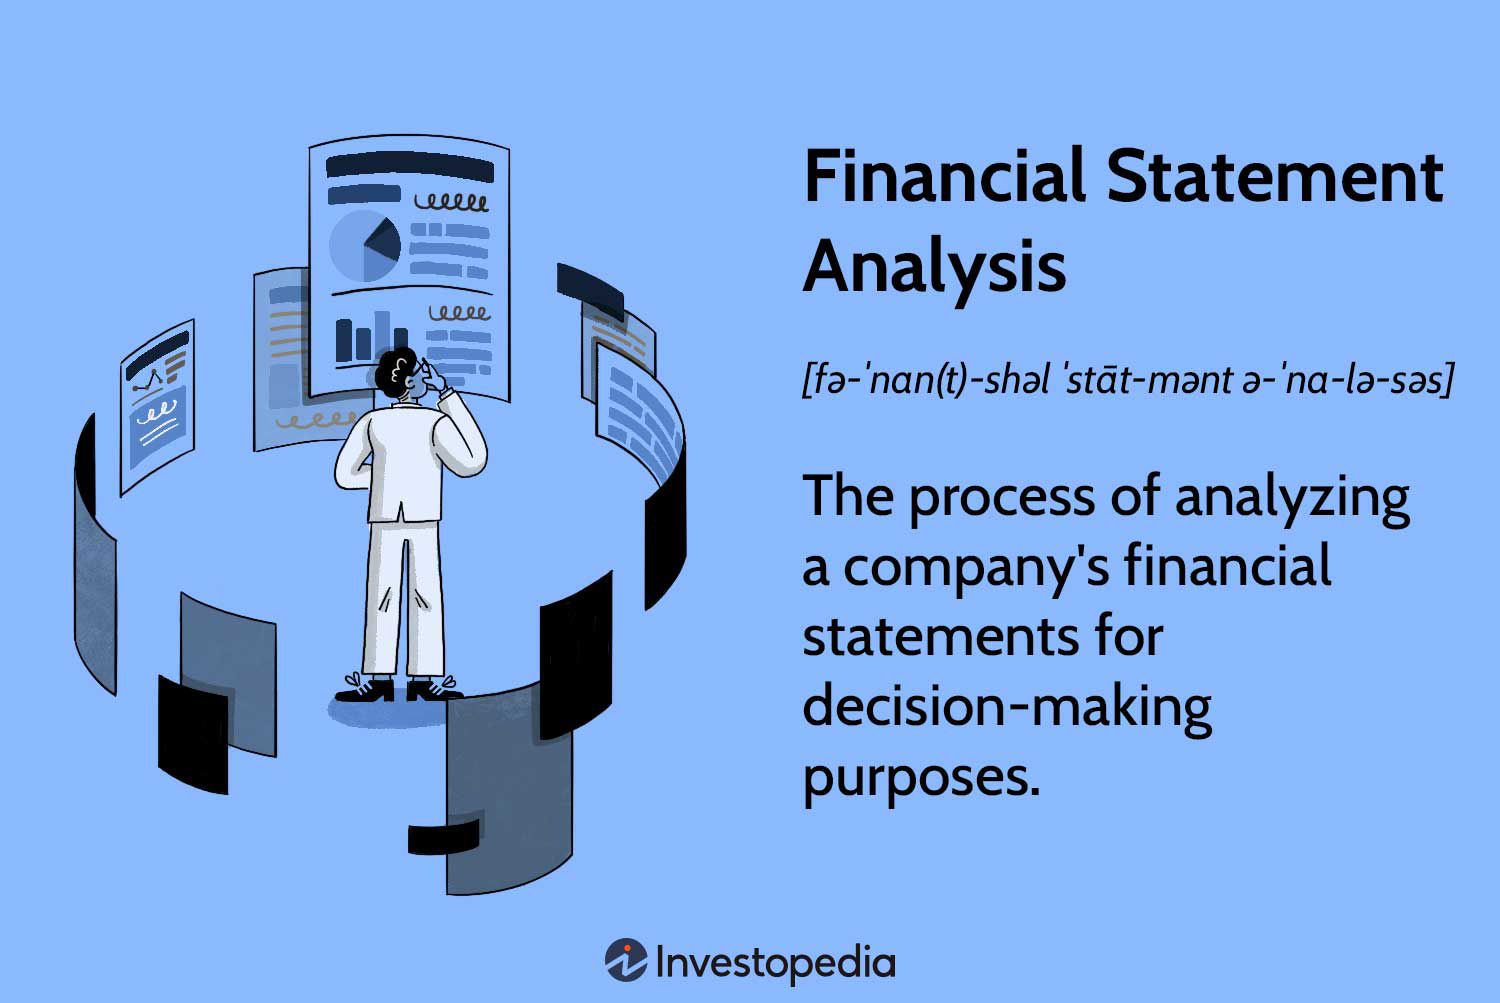
Fundamental analysis is essential for understanding the intrinsic value of stocks. As a beginner, you can effectively perform this analysis without spending a dime by utilizing several free resources. Here are some key components to focus on:
| Component | Description | Free Tools |
|---|---|---|
| Earnings Reports | Analyze a company’s financial performance over time. | SEC’s EDGAR, Yahoo Finance |
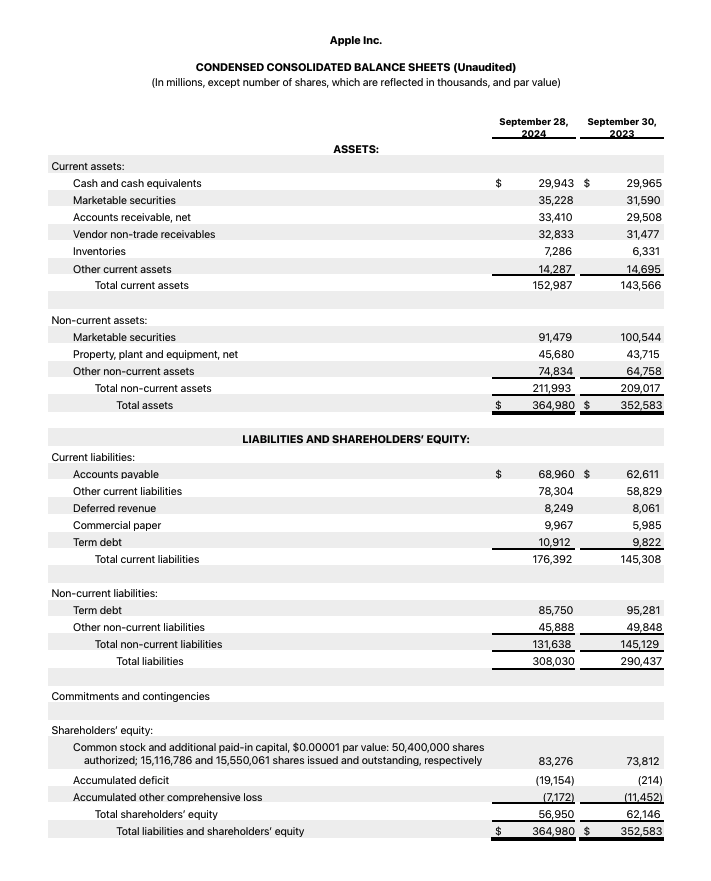
| Balance Sheets | Assess a company’s assets, liabilities, and equity. | Google Finance, MarketWatch |
| Cash Flow Statements | Understand the cash inflows and outflows. | Financial Modeling Prep, Simply Wall St |
| Valuation Ratios | Use ratios like P/E and P/B to gauge value. | Financial news sites, Investopedia |
To start, explore financial news sites or community forums where investors discuss insights about stocks. Always remember to assess market trends and economic indicators which can help to contextualize your findings. By leveraging these free tools and resources, beginners can dive deep into Stock Market Analysis and build a solid foundation for investment decisions.
Interpreting Stock Market Trends Through Free Platforms
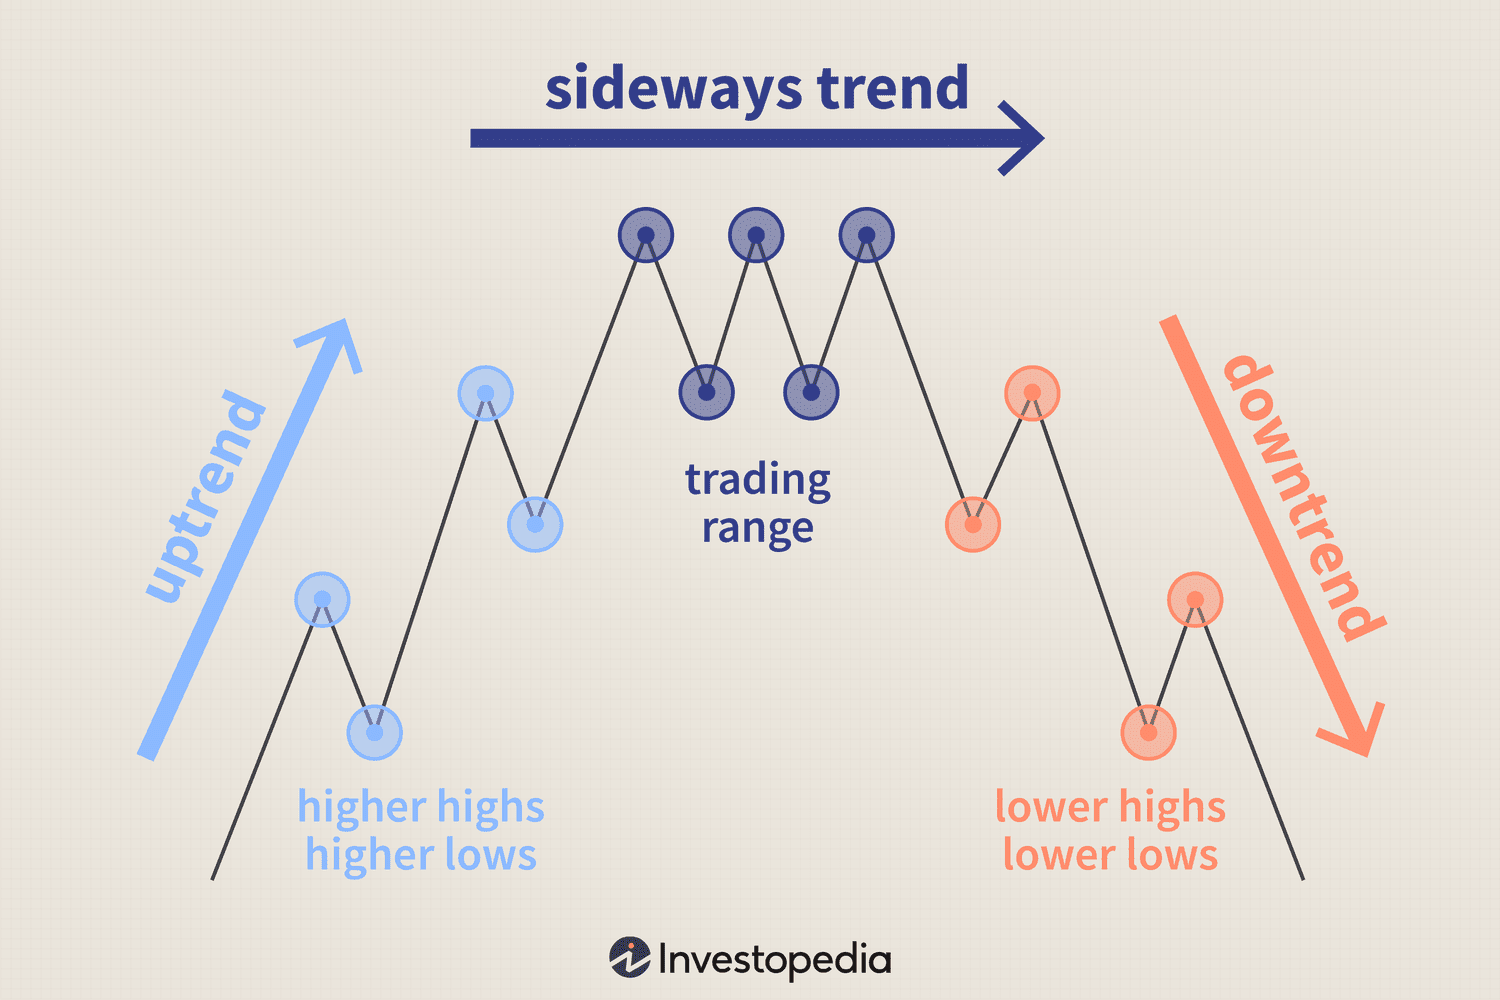
Analyzing stock market trends is crucial for making informed trading decisions. Fortunately, several free platforms are available that facilitate this task. For instance, platforms like Yahoo Finance and Google Finance not only provide real-time data but also display historical price movements, which are essential for trend analysis.
| Platform | Key Features | Best For |
|---|---|---|
| Yahoo Finance | News, charts, portfolio tracking | Investors seeking insights |
| Google Finance | Customizable watchlists, graphs | Quick access to data |
| TradingView | Extensive charting capabilities | Technical analysis |
| Finviz | Stock screening and visualization | Finding potential stocks |
Utilizing these tools effectively involves identifying patterns such as moving averages and price action. By paying attention to these indicators, users can predict potential price movements. Remember, while Stock Market Analysis using free platforms might lack some advanced features of paid services, with a little practice, you can still achieve reliable insights and improve your trading strategy.
Frequently Asked Questions
What are some free tools available for stock market analysis?
There are numerous free tools available for stock market analysis that cater to both novice and experienced investors. Some popular options include Yahoo Finance, Google Finance, and TradingView, which provide real-time stock quotes, news updates, charting features, and tutorial videos. Additionally, websites like Finviz and Seeking Alpha offer advanced screening and analysis tools that are accessible without a subscription, allowing users to analyze company fundamentals, market trends, and technical indicators at no cost.
How can I utilize historical stock data for analysis?
Utilizing historical stock data is crucial for performing stock market analysis, as it allows investors to identify patterns and trends over time. Free databases such as Yahoo Finance or Alpha Vantage provide access to historical price data, including daily opening and closing prices, trading volume, and market capitalization. Investors can download this data in spreadsheet format to perform their own statistical analyses, construct moving averages, and backtest investment strategies, aiding them in making informed future investment decisions.
What are the key indicators I should look for in stock market analysis?
When analyzing stocks, several key indicators should be assessed to determine the potential performance of a stock. These include price-to-earnings (P/E) ratio, earnings per share (EPS), and dividend yield, which provide insight into a company’s profitability and value. Technical indicators like moving averages, relative strength index (RSI), and Bollinger Bands can also be valuable for forecasting price movements and understanding market sentiment. Monitoring these indicators enables investors to make well-rounded decisions regarding stock purchases or sales.
Is it necessary to have prior experience to perform stock market analysis?
No, prior experience is not a requirement to perform stock market analysis, especially with the abundance of free resources and educational materials available today. While having some background knowledge can be beneficial, beginners can utilize online courses, tutorials, and informative blogs to understand fundamental and technical analysis techniques. Engaging with communities, such as finance forums or social media groups, can provide additional support and insights, making stock market analysis accessible to anyone willing to learn.