How to Analyze Company Earnings Reports for Smarter Investment Decisions

Investing wisely in the stock market requires a solid understanding of the financial health of the companies you’re interested in. One of the most vital tools in this assessment is the Earnings Reports released by companies each quarter. These reports provide a treasure trove of information about a company’s profitability, revenue trends, and overall performance. However, simply reading them isn’t enough; you need to know how to navigate through the complexities and extract actionable insights. In this blog post, we’ll guide you through the essential components of earnings reports, teach you how to interpret key indicators like Earnings Per Share (EPS) and revenue growth, and highlight common pitfalls to avoid. Equipped with this knowledge, you’ll be better positioned to make smarter investment decisions.
Understanding the Basics of Earnings Reports
When diving into the world of investing, understanding Earnings Reports is crucial. These financial documents provide insights into a company’s performance over a specified period, typically a quarter or a year. Here are the foundational elements to grasp:
- Purpose of Earnings Reports: They offer transparency regarding a company’s profitability, helping investors make informed decisions.
- Frequency: Most public companies release these reports quarterly and annually.
- Key Players: Earnings Reports typically include the income statement, balance sheet, and cash flow statement.
| Element | Description |
|---|---|
| Income Statement | Details revenue, expenses, and profit or loss. |
| Balance Sheet | Snapshot of assets, liabilities, and equity at a point in time. |
| Cash Flow Statement | Overview of cash inflows and outflows over a period. |
By mastering these basics, you’ll be better equipped to interpret the data presented in Earnings Reports effectively.
Key Components of Earnings Reports You Should Know
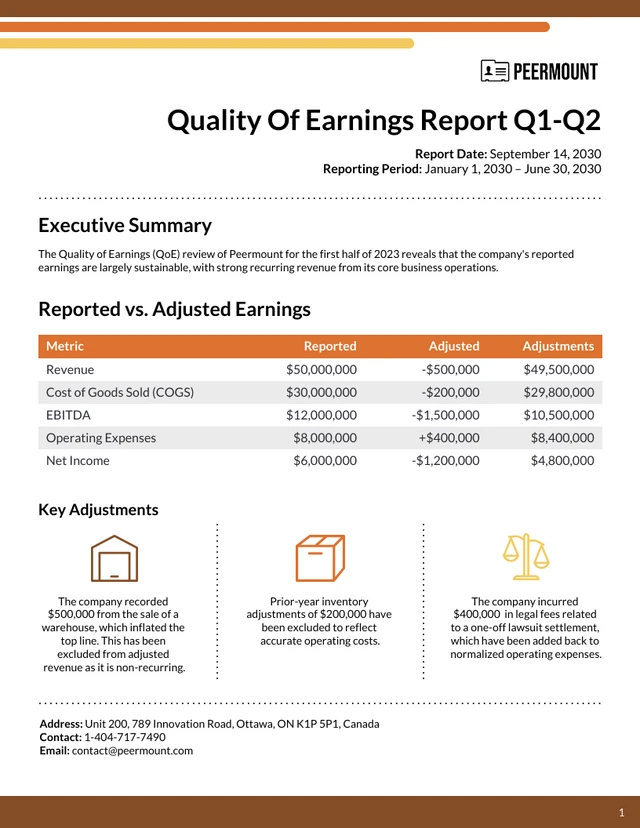
Analyzing Earnings Reports is essential for making informed investment decisions. Understanding the key components within these reports can help you evaluate a company’s financial health and performance. Here are some crucial elements to consider:
| Component | Description |
|---|---|
| Revenue | Total income generated before any expenses are deducted. |
| Net Income | Profit after all expenses, taxes, and costs are subtracted from revenue. |
| Earnings Per Share (EPS) | Net income divided by the number of outstanding shares, indicating profitability per share. |
| Operating Income | Income from regular business operations, excluding non-operational income like interest or sales. |
| Gross Margin | Difference between revenue and cost of goods sold, expressed as a percentage, reflecting production efficiency. |
By focusing on these key components, investors can better understand a company’s performance over time. Stay mindful of how these figures impact overall company valuation and future growth potential.
How to Interpret Earnings Per Share (EPS) and Revenue Growth
When analyzing Earnings Reports, two critical indicators stand out: Earnings Per Share (EPS) and revenue growth. EPS represents a company’s profitability on a per-share basis and is calculated by dividing total net income by the number of outstanding shares. A higher EPS often signals a more profitable company, enticing investors.
| Metric | Q1 2023 | Q2 2023 | Q3 2023 |
|---|---|---|---|
| Earnings Per Share | $2.50 | $3.00 | $3.50 |
| Revenue Growth | 5% | 10% | 15% |
In this example, notice the upward trend in both EPS and revenue growth over the quarters. This consistent improvement suggests healthy performance and growth potential. To make informed investment decisions, evaluate these metrics not just in isolation but in the context of industry averages and historical performance. Therefore, a combination of rising EPS and robust revenue growth can define a company poised for long-term success.
The Importance of Comparing Earnings Reports Across Quarters
When it comes to making informed investment decisions, comparing Earnings Reports across quarters is essential. This analysis offers valuable insights into a company’s performance trends and overall health. Here are some key reasons why quarterly comparisons matter:
- Trend Identification: Monitoring earnings over successive quarters helps identify upward or downward trends in revenue and profit margins.
- Seasonal Patterns: Certain businesses experience seasonal fluctuations. Quarterly analysis allows investors to gauge how well companies perform during peak and off-peak seasons.
- Benchmarking Against Competitors: By comparing a company’s quarterly earnings with rivals, you can assess relative performance and market positioning.
Key Metrics to Consider
| Metric | Importance |
|---|---|
| Earnings Per Share (EPS) | Indicates profitability and shareholder value. |
| Revenue Growth | Reflects overall sales performance. |
| Operating Margin | Shows efficiency in managing costs. |
Utilizing this approach, investors can make smarter, more strategic decisions by recognizing patterns and potential risks before committing to a stake in the company.
Using Earnings Reports to Assess Company Performance
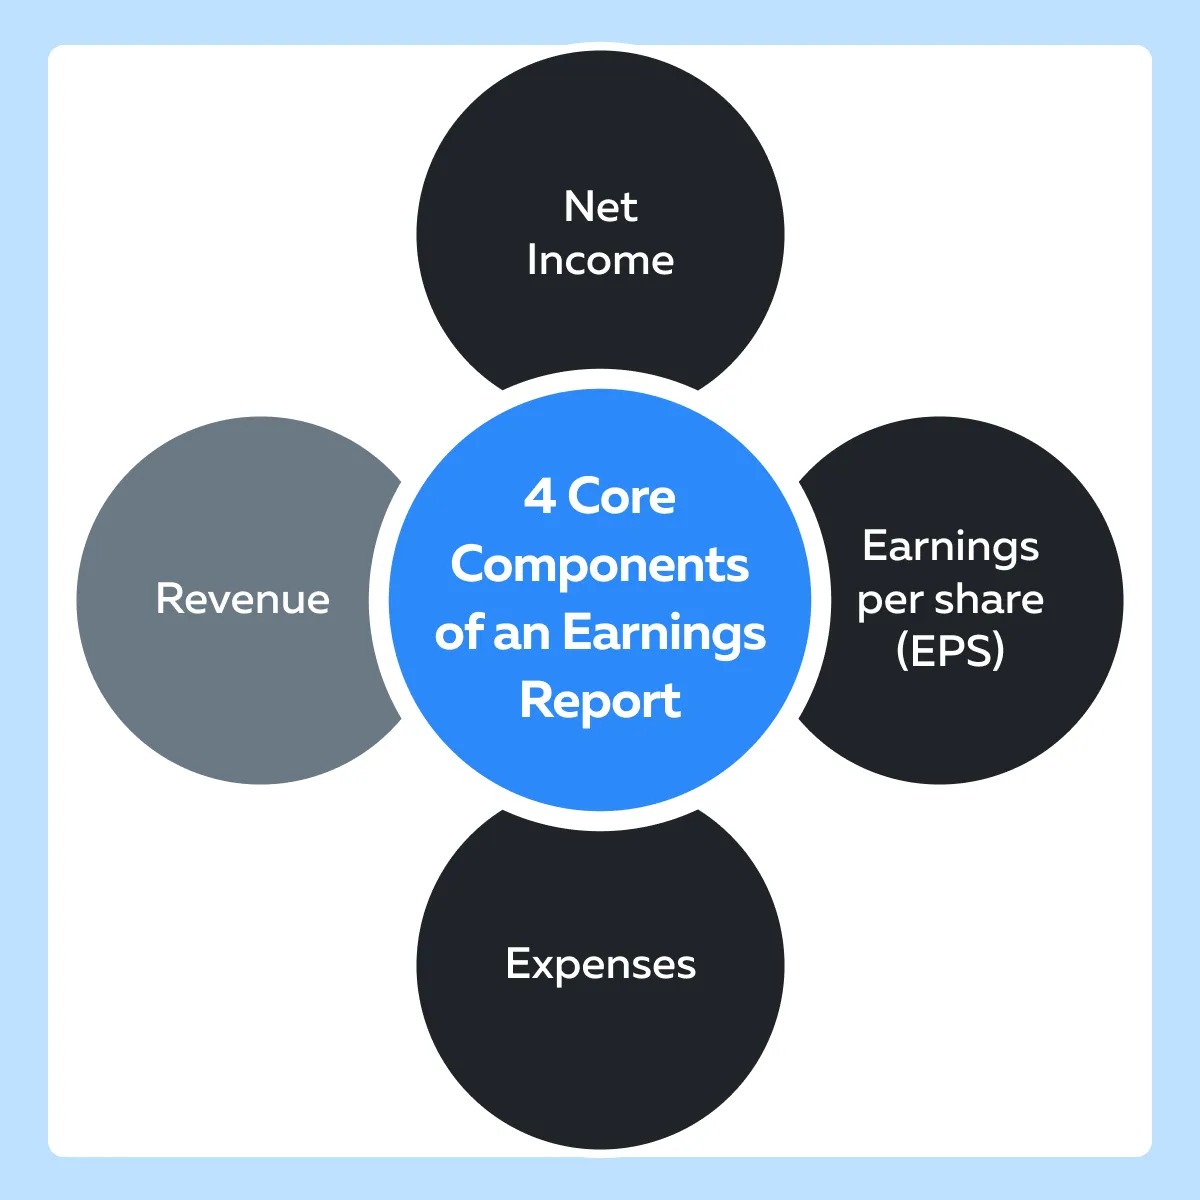
Analyzing Earnings Reports is crucial for evaluating a company’s performance accurately. Investors can uncover valuable insights when they focus on specific metrics. Here are key components to consider:
| Component | Significance |
|---|---|
| Revenue | Indicates overall sales performance over time. |
| Net Income | Reflects profitability after all expenses. |
| Earnings Per Share (EPS) | Measures profitability on a per-share basis. |
| Cash Flow | Shows the liquidity available for operations. |
| Guidance | Provides future expectations set by company leaders. |
Utilizing these metrics allows investors to evaluate trends and make informed decisions. For instance, a consistent increase in EPS combined with positive revenue growth suggests a healthy company trajectory. Conversely, declining net income can indicate potential issues. Hence, a thorough assessment of Earnings Reports equips investors with the necessary tools to navigate the market effectively.
Common Pitfalls to Avoid When Analyzing Earnings Reports
When evaluating Earnings Reports, investors must navigate several common pitfalls that can lead to misguided decisions. One significant mistake is relying solely on one quarter’s data in isolation. Instead, consider historical context by comparing reports over multiple quarters to identify trends.
| Pitfall | Description | Solution |
|---|---|---|
| Overlooking Non-GAAP Metrics | Non-GAAP metrics can distort a company’s true performance. | Always review GAAP figures for clarity. |
| Ignoring Market Conditions | Focusing exclusively on the numbers may cause you to miss broader economic influences. | Assess industry trends and market conditions. |
| Neglecting Forward Guidance | Companies often provide insights into future performance which can be critical. | Pay attention to management’s forward-looking statements. |
| Emotional Decision Making | Investing based on emotions rather than data might lead to losses. | Stick to a disciplined analysis approach based on facts. |
By being aware of these pitfalls, investors can make more informed decisions and leverage Earnings Reports to their full potential.
Frequently Asked Questions
What are company earnings reports and why are they important for investors?
Company earnings reports are quarterly and annual statements that publicly traded companies submit to disclose their financial performance. These reports often include information on revenue, net income, earnings per share (EPS), and other key metrics. For investors, analyzing these reports is crucial as they provide insights into a company’s profitability, operational efficiency, and overall financial health, enabling smarter investment decisions based on performance trends.
How can I effectively analyze an earnings report?
To effectively analyze an earnings report, start by examining the revenue and EPS figures, comparing them to both previous periods and analyst expectations. Look for explanations on any significant variances in these numbers in the management discussion section. It’s also essential to analyze sector performance and compare the company’s metrics against peers. Additionally, consider reviewing guidance provided by the management, which may give insight into future performance and strategic direction.
What key metrics should I focus on in an earnings report?
When analyzing an earnings report, key metrics to focus on include revenue growth, net income, operating margin, and earnings per share (EPS). Furthermore, evaluate cash flow statements to ensure the company is generating cash efficiently. Look for metrics like return on equity (ROE) and debt-to-equity ratios, as they provide insights into a company’s financial health and risk profile. Collectively, these metrics will offer a comprehensive view of the company’s performance.
How do market reactions to earnings reports influence stock prices?
Market reactions to earnings reports can significantly influence stock prices, often resulting in immediate and sometimes volatile movements. If a company reports better-than-expected earnings, the stock may rise as investors show optimism about future growth prospects. Conversely, disappointing results can lead to price drops, as investors reassess their outlook on the company’s stability and profitability. It’s important to note that the larger context, including market conditions and investor sentiment, also plays a crucial role in these reactions.