How to Perform Industry Analysis Before Investing in Any Sector
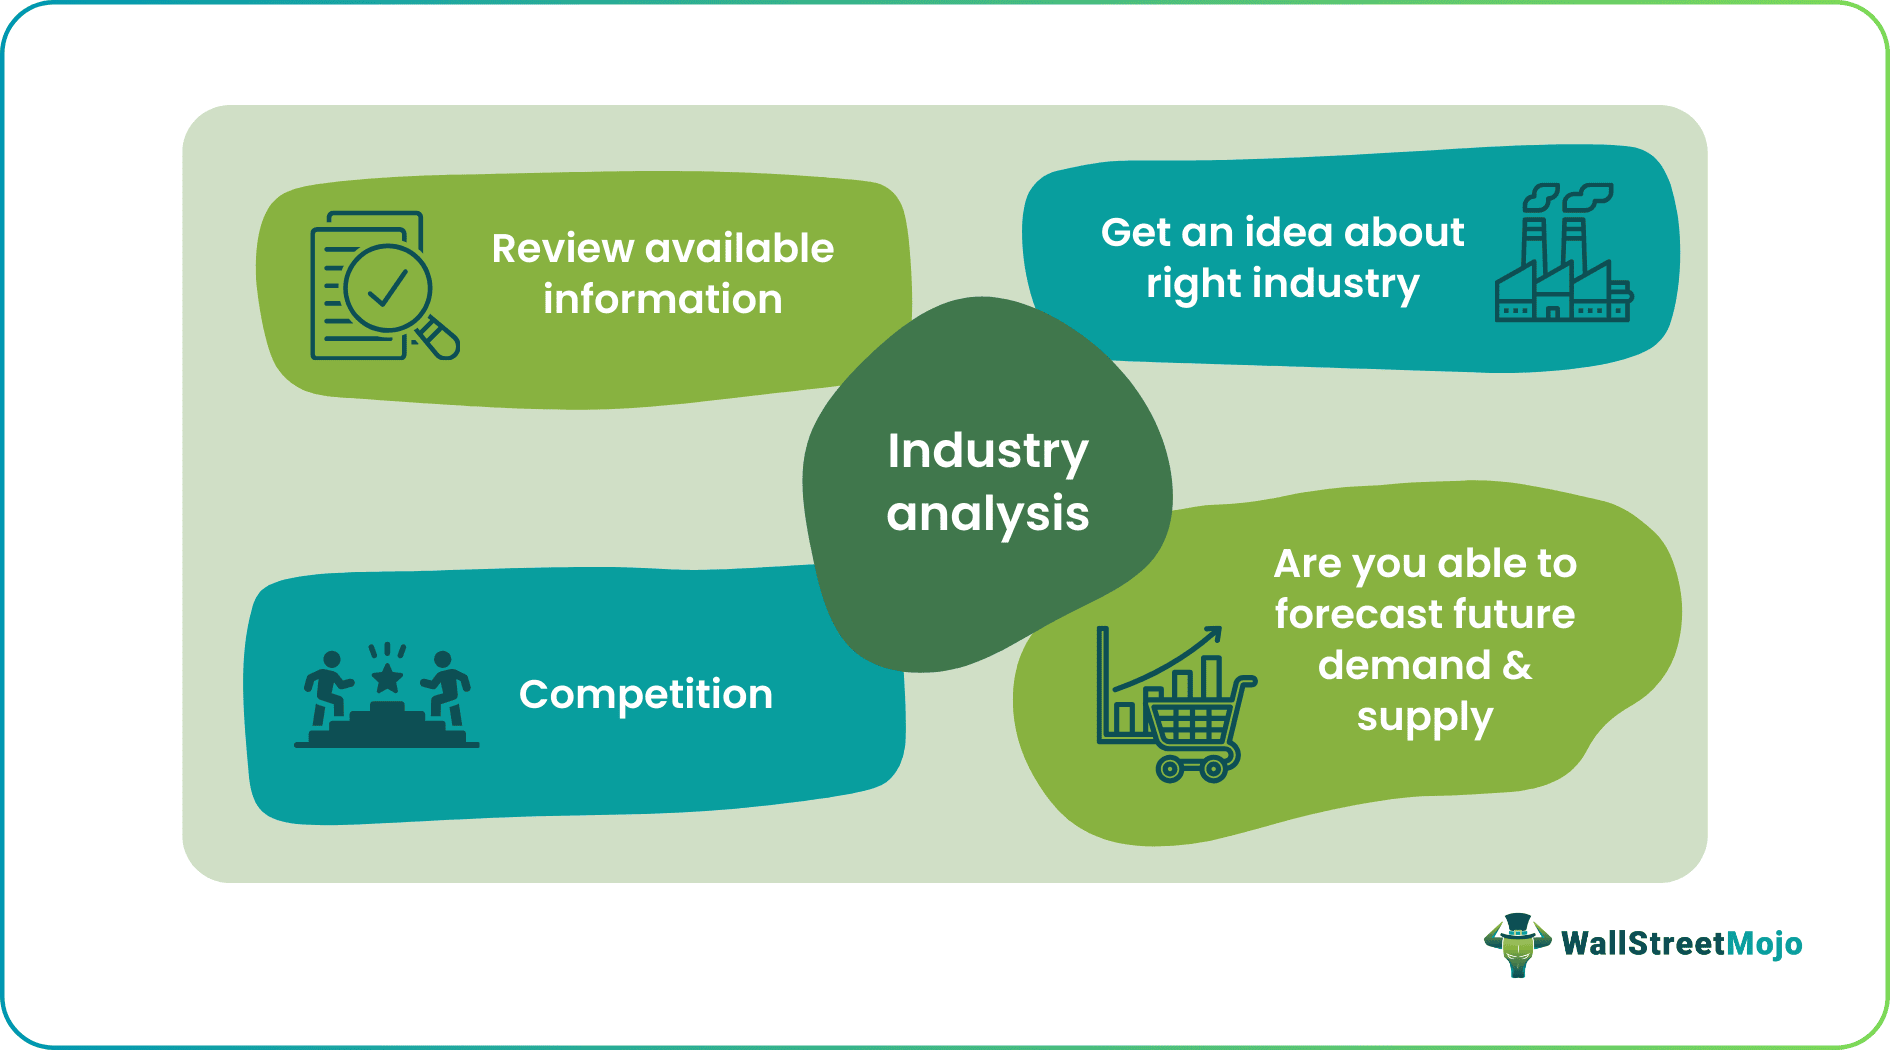
Investing in any sector requires a deep understanding of the market landscape, and that’s where Industry Analysis plays a crucial role. By thoroughly examining various industries, investors can uncover valuable insights that directly influence their decisions. This blog post will guide you through the essential elements of industry analysis, including the importance of key metrics, effective tools and techniques, and the identification of emerging trends and potential risks. By arming yourself with this knowledge, you’ll be well-prepared to make informed investment choices that align with your financial goals.
Understanding the Importance of Industry Analysis
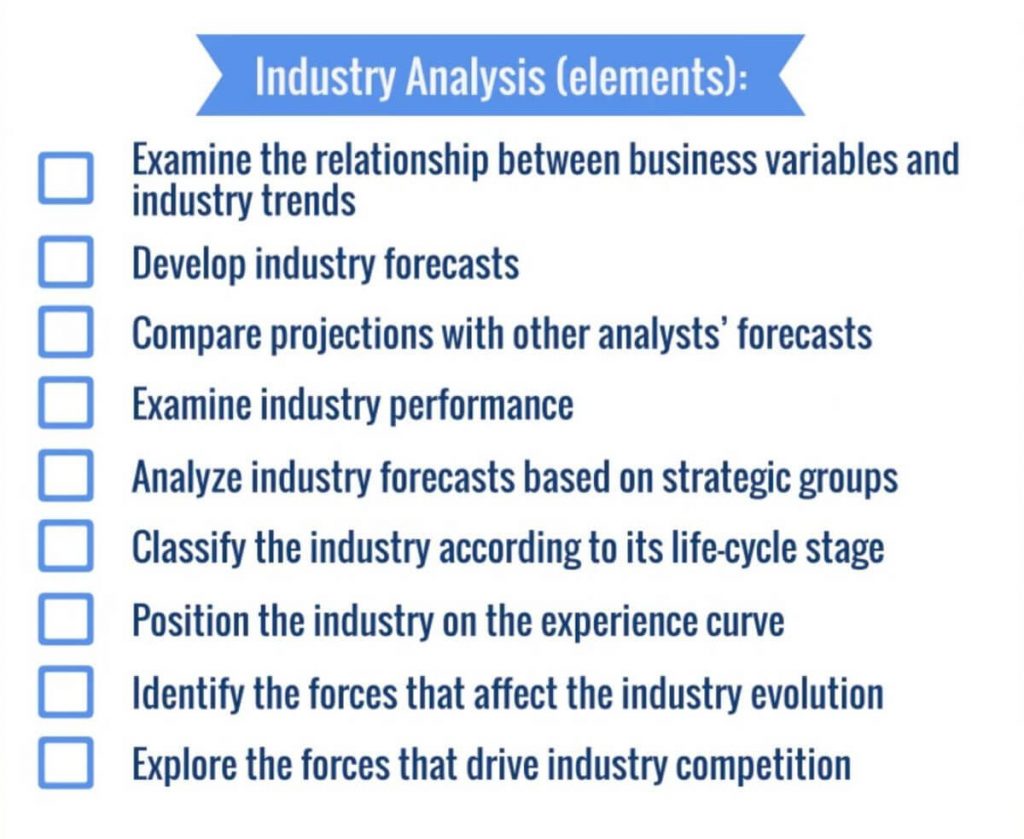
Conducting Industry Analysis is a vital step for investors looking to make informed decisions. By understanding the dynamics of a specific sector, investors can avoid pitfalls and identify lucrative opportunities. Here are some key reasons why Industry Analysis is essential:
- Market Insight: Gain a deeper understanding of market size, growth potential, and competitive landscape.
- Risk Mitigation: Identify potential risks associated with investment in a sector, helping you develop strategies to minimize losses.
- Informed Decision-Making: Use data-driven insights to support your investment strategies, increasing the likelihood of success.
- Trend Recognition: Spot emerging trends and patterns that could impact your investments.
| Key Aspect | Importance |
|---|---|
| Market Dynamics | Understanding forces shaping the industry |
| Competitive Advantage | Identifying strengths and weaknesses of competitors |
| Regulatory Environment | Awareness of laws that may affect the sector |
| Technology Trends | Recognizing how innovation can disrupt markets |
By prioritizing Industry Analysis, investors empower themselves with knowledge, enhancing their ability to thrive in the marketplace.

Key Metrics to Evaluate in Industry Analysis
When performing Industry Analysis, it’s essential to focus on specific metrics that provide insights into sector dynamics. Here are some key metrics to evaluate:
| Metric | Description |
|---|---|
| Market Growth Rate | Indicates the overall growth potential of the industry, reflecting demand trends. |
| Market Share | Measures the company’s portion in the industry, illustrating competitive strength. |
| Profit Margins | Evaluates a firm’s profitability relative to its revenues, helping assess financial health. |
| Customer Acquisition Cost (CAC) | Calculates the expense involved in attracting a new customer, pivotal for growth strategies. |
| Return on Investment (ROI) | Assesses the efficiency of investments in the sector, guiding future decisions. |
| Regulatory Environment | Considers the impact of laws and regulations, which can greatly influence operational costs and market entry. |
By closely analyzing these metrics, investors can gain a robust understanding of the industry landscape, enabling informed investment choices and strategic planning.
Tools and Techniques for Effective Industry Analysis
When embarking on Industry Analysis, selecting the right tools and techniques can significantly refine your investment decisions. Market Research Reports provide detailed insights into market trends and competitive landscapes, while SWOT analysis helps in identifying the Strengths, Weaknesses, Opportunities, and Threats within an industry.
Furthermore, utilizing Porter’s Five Forces framework offers a structured approach to evaluating industry competitiveness. This technique analyzes competition intensity, bargaining power of suppliers and buyers, along with the threats from substitutes and new entrants.
| Tool/Technique | Description |
|---|---|
| Market Research Reports | Comprehensive insights into market trends justifying investment choices. |
| SWOT Analysis | Identifies internal and external factors affecting industry performance. |
| Porter’s Five Forces | Assesses competitive forces that shape industry dynamics. |
| Financial Ratios | Measures profitability, liquidity, and market valuation for informed decisions. |
By incorporating these tools into your Industry Analysis, you gain a multidimensional perspective that enhances your understanding of market dynamics, allowing for well-informed investment strategies.
Identifying Trends and Opportunities in Industry Analysis
In today’s fast-paced market, recognizing emerging trends and opportunities is crucial for successful investing. An effective Industry Analysis enables investors to pinpoint valuable insights and potential growth areas. Here are some essential strategies to identify trends:
- Market Research: Regularly analyze consumer behavior and preferences to understand shifts in demand.
- Competitor Analysis: Keep an eye on competitors’ strategies and innovations to determine market direction.
- Technological Advancements: Assess how new technologies can disrupt or elevate industries.
Key Areas to Monitor
| Trend Indicator | Description |
|---|---|
| Consumer Trends | Changing customer preferences impacting demand |
| Regulatory Changes | New laws affecting market operations |
| Economic Indicators | Economic shifts influencing industry viability |
| Social Media Insights | Feedback and trends emerging from social channels |
Utilizing these tools will help you navigate the investment landscape more effectively, uncovering opportunities that align with your financial goals.
Assessing Risks Involved Through Industry Analysis
Assessing risks is a crucial component of Industry Analysis that investors must undertake. Understanding potential pitfalls can mitigate financial losses and enhance investment decisions. Here are some essential risk factors to consider:
| Risk Factor | Description |
|---|---|
| Market Fluctuations | Economic changes can rapidly affect market demand and supply conditions. |
| Regulatory Challenges | New legislation or changes in regulations can impact industry operations significantly. |
| Competitive Landscape | The entry of new players or aggressive strategies by competitors may threaten existing businesses. |
| Technological Shifts | Rapid technological advancements can render current products or services obsolete. |
| Supply Chain Risks | Disruptions in the supply chain can create operational challenges and increase costs. |
By analyzing these risk factors in the context of the industry, investors can better prepare for potential challenges. Employing this method allows for a comprehensive view, ensuring that decisions are based on a well-rounded understanding of the landscape. Thus, effective Industry Analysis empowers investors to navigate uncertainties with greater confidence.
Making Informed Investment Decisions Based on Industry Analysis
When it comes to Industry Analysis, making informed investment decisions is crucial. By synthesizing data gleaned from various metrics, investors can pinpoint the right sectors for their capital. Here are some factors to consider:
1. Comprehensive Understanding:
Utilize insights from your analysis to gauge the market dynamics. Understand the competitive landscape, as well as the growth potential of specific industries.
2. Data-Driven Projections:
Leverage metrics such as market share, historical performance, and economic indicators. For instance, a comparison of industry growth rates can highlight which sectors are gaining traction.
| Metric | Industry A (%) | Industry B (%) | Industry C (%) |
|---|---|---|---|
| Growth Rate | 5 | 8 | 3 |
| Market Share | 20 | 50 | 30 |
| Profit Margin | 15 | 12 | 10 |
3. Risk Assessment:
Evaluating potential risks is imperative. Factors like regulatory challenges and market volatility can sway investment decisions.
By applying insights from your Industry Analysis, make well-rounded decisions that align with your financial goals. Investing is not just about numbers; it’s about understanding the broader picture to minimize risks and maximize returns.
Frequently Asked Questions
What is industry analysis and why is it important for investors?
Industry analysis is a method that assists investors in evaluating a particular sector’s performance, trends, and dynamics. It involves examining various elements such as market size, growth potential, competitive landscape, and regulatory environment. For investors, understanding these factors is crucial because it helps them make informed decisions, identify promising investment opportunities, and mitigate risks associated with specific industries. By conducting a thorough industry analysis, investors can align their strategies with market conditions and enhance their potential for successful investments.
What key factors should I consider when performing industry analysis?
When performing industry analysis, several key factors should be considered to gain a comprehensive understanding of the sector. These include market trends, consumer behavior, competition levels, economic indicators, regulatory changes, and technological advancements. Additionally, analyzing the supply chain dynamics and potential barriers to entry can provide insights into the operational aspects of the industry. Understanding these factors enables investors to evaluate the long-term viability of a sector, thereby aiding in strategic decision-making and investment planning.
How can I gather data for my industry analysis?
Data for industry analysis can be gathered from various sources, including market research reports, industry publications, government statistics, and academic journals. Online databases like Statista and IBISWorld are excellent resources for obtaining statistical data and industry insights. Additionally, conducting surveys or interviews with industry insiders can offer unique perspectives on market dynamics. Engaging in networking within industry forums, attending conferences, and utilizing professional social networks like LinkedIn can further enhance your understanding and access to relevant information.
How often should I conduct an industry analysis?
The frequency of conducting an industry analysis typically depends on the specific sector and the velocity of change within it. In fast-paced industries such as technology or healthcare, it is advisable to perform analysis more frequently – possibly quarterly or biannually. For more stable sectors, an annual analysis may suffice. However, it is crucial to stay updated with significant market shifts, regulatory changes, or emerging trends that could impact investments, necessitating timely assessments to adapt investment strategies appropriately.