Top Tools for Analyzing Financial Statements Quickly
In today’s fast-paced business environment, the ability to swiftly and accurately interpret financial statements is crucial for informed decision-making. Understanding a company’s financial health requires not just a basic grasp of accounting, but also the right tools to facilitate effective analysis. This is where technology steps in, offering a plethora of solutions designed to efficiently dissect and present data. In this blog post, we will explore the importance of financial statement analysis, the essential features to seek in analytical tools, and the top software options available. Additionally, we will compare manual versus automated approaches and examine case studies that highlight the transformative impact of these tools on financial analysis. Whether you’re a seasoned analyst or a business owner, this guide will help you select the right tools to enhance your financial review process.
Importance of Financial Statement Analysis
Understanding the significance of financial statement analysis is crucial for any business or investor. It provides insights that drive decision-making and strategic planning. Here are key reasons why it matters:
- Assessing Performance: It helps in evaluating a company’s financial health, profitability, and operational efficiency.
- Identifying Trends: With the right tools, one can spot financial trends over time, providing a clearer picture of growth potential.
- Guiding Investments: Investors rely on this analysis to determine the right stock to buy or sell based on a company’s past performance.
- Risk Management: By analyzing financial statements, businesses can identify potential risks and take proactive measures to mitigate them.
| Key Aspect | Explanation |
|---|---|
| Financial Health | Measures assets vs. liabilities |
| Profitability Analysis | Reviews income statements for earnings |
| Trend Analysis | Tracks performance over multiple periods |
| Risk Identification | Spotting potential financial pitfalls |
In essence, utilizing these insights is vital for making informed decisions and ensuring long-term success in any financial endeavor.
Features to Look for in Financial Analysis Tools
When selecting financial analysis tools, it’s essential to consider several key features to ensure that the software meets your needs. Here are some important attributes to look for:
| Feature | Description |
|---|---|
| User-Friendly Interface | A clean, intuitive design that promotes easy navigation. |
| Data Integration | Capability to connect with various accounting systems and data sources seamlessly. |
| Customizable Reports | Ability to generate tailored reports to focus on specific financial metrics. |
| Visual Analytics | Interactive charts and graphs for better data visualization and insights. |
| Real-Time Analysis | Updates and analyses performed in real-time for timely decision-making. |
| Collaboration Tools | Features that allow teams to work together efficiently, sharing insights and annotations. |
By ensuring your chosen tool incorporates these key features, you can streamline your financial statement analysis process, enhance your productivity, and make well-informed decisions. Investing in the right software will help you extract actionable insights quickly, resulting in better financial management.
Top Software for Financial Statement Analysis
When it comes to evaluating a company’s performance, several software options stand out for their effectiveness and user-friendly designs. QuickBooks, for example, is ideal for small businesses, offering a comprehensive solution that includes income statement generation alongside budget comparisons.
Tiller Money excels in automation, allowing you to link your financial accounts and gain insights effortlessly. Its customizable spreadsheets cater to unique analysis needs, making it a favorite among finance professionals.
Microsoft Excel remains a classic choice due to its versatile functions and spreadsheet capabilities, enabling users to perform in-depth analysis with the power of formulas and macros.
| Software | Best For | Key Features |
|---|---|---|
| QuickBooks | Small Businesses | Income tracking, budgeting tools |
| Tiller Money | Automation | Customizable spreadsheets |
| Microsoft Excel | Versatile Analysis | Advanced formulas, pivot tables |
Ultimately, the choice of software depends on your specific analytical needs and your comfort with technology. Each of these tools provides unique features that can assist in making data-driven decisions, streamlining the process of assessing financial health effectively.
Comparative Analysis: Manual vs. Automated Tools
When it comes to financial statement analysis, choosing between manual methods and automated tools can significantly impact your efficiency and accuracy. Here’s a breakdown of their differences:
| Aspect | Manual Tools | Automated Tools |
|---|---|---|
| Speed | Slower; involves extensive calculations | Instant analysis; saves time |
| Accuracy | Prone to human error | High accuracy; minimizes mistakes |
| User-Friendliness | Requires specialized knowledge | Often designed with user interfaces |
| Data Handling | Difficulty managing large datasets | Effortlessly handles vast information |
| Reporting Capabilities | Basic insights | Advanced insights with visualizations |
Key Differences:
- Cost: Manual methods may be cheaper initially but often require more time investment.
- Flexibility: Automated tools can adapt to various scenarios quickly, while manual tools can be rigid.
- Updates: Automated tools frequently update to reflect latest regulations and standards, keeping you compliant without additional effort.
Understanding these distinctions can guide you in selecting the most effective tool for your financial statement analysis needs.
Case Studies: Successful Financial Analysis with Tools
Financial statement analysis is essential for businesses aiming for growth and stability. Various companies have leveraged tools to enhance their analysis capabilities, yielding impressive results. Here are a few notable case studies demonstrating the success achieved through these financial analysis tools:
| Company | Tool Used | Outcome |
|---|---|---|
| Tech Innovations | Automated Analysis Tool | Streamlined data interpretation led to a 25% increase in investment decisions. |
| Green Enterprises | Cloud-Based Software | Enhanced collaboration resulted in faster financial reporting and a 30% reduction in errors. |
| Retail Solutions | Financial Dashboard | Improved insights into sales trends enabled strategic inventory management, boosting profits by 15%. |
These examples illustrate how utilizing the right tools for financial statement analysis can significantly enhance decision-making processes and drive business success. By harnessing technology, companies not only save time but also gain deeper insights into their financial health, proving that effective analysis is indispensable in today’s competitive market.
Frequently Asked Questions
What are financial statement analysis tools?
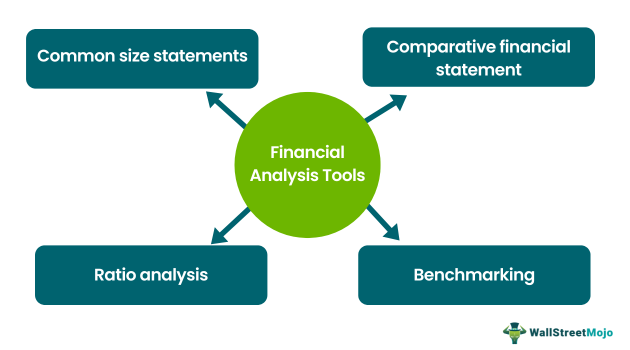
Financial statement analysis tools are specialized software or platforms that help individuals and businesses analyze, interpret, and visualize data from financial statements such as balance sheets, income statements, and cash flow statements. These tools can help in performing ratio analysis, trend analysis, and comparisons among industries. By simplifying complex financial data, they enable users to make informed decisions based on the financial health of a company.
How do these tools improve the speed of financial analysis?
These tools significantly enhance the speed of financial analysis by automating data entry, calculations, and visualizations, which traditionally require considerable time and effort if done manually. Features like preset templates for financial ratios, instant access to historical data, and the ability to generate reports with just a few clicks allow analysts to focus more on interpretation rather than data manipulation, thus speeding up the overall analysis process.
Are these tools suitable for both beginners and experienced analysts?
Yes, financial statement analysis tools cater to a wide range of users, from beginners to experienced financial analysts. Many tools offer user-friendly interfaces, guides, and tutorials that can help newcomers understand financial metrics and analyses. At the same time, advanced features such as customizable dashboards, in-depth analytical capabilities, and integration with other financial systems provide seasoned analysts with the sophisticated tools they need for detailed analysis.
What features should I look for in a financial statement analysis tool?
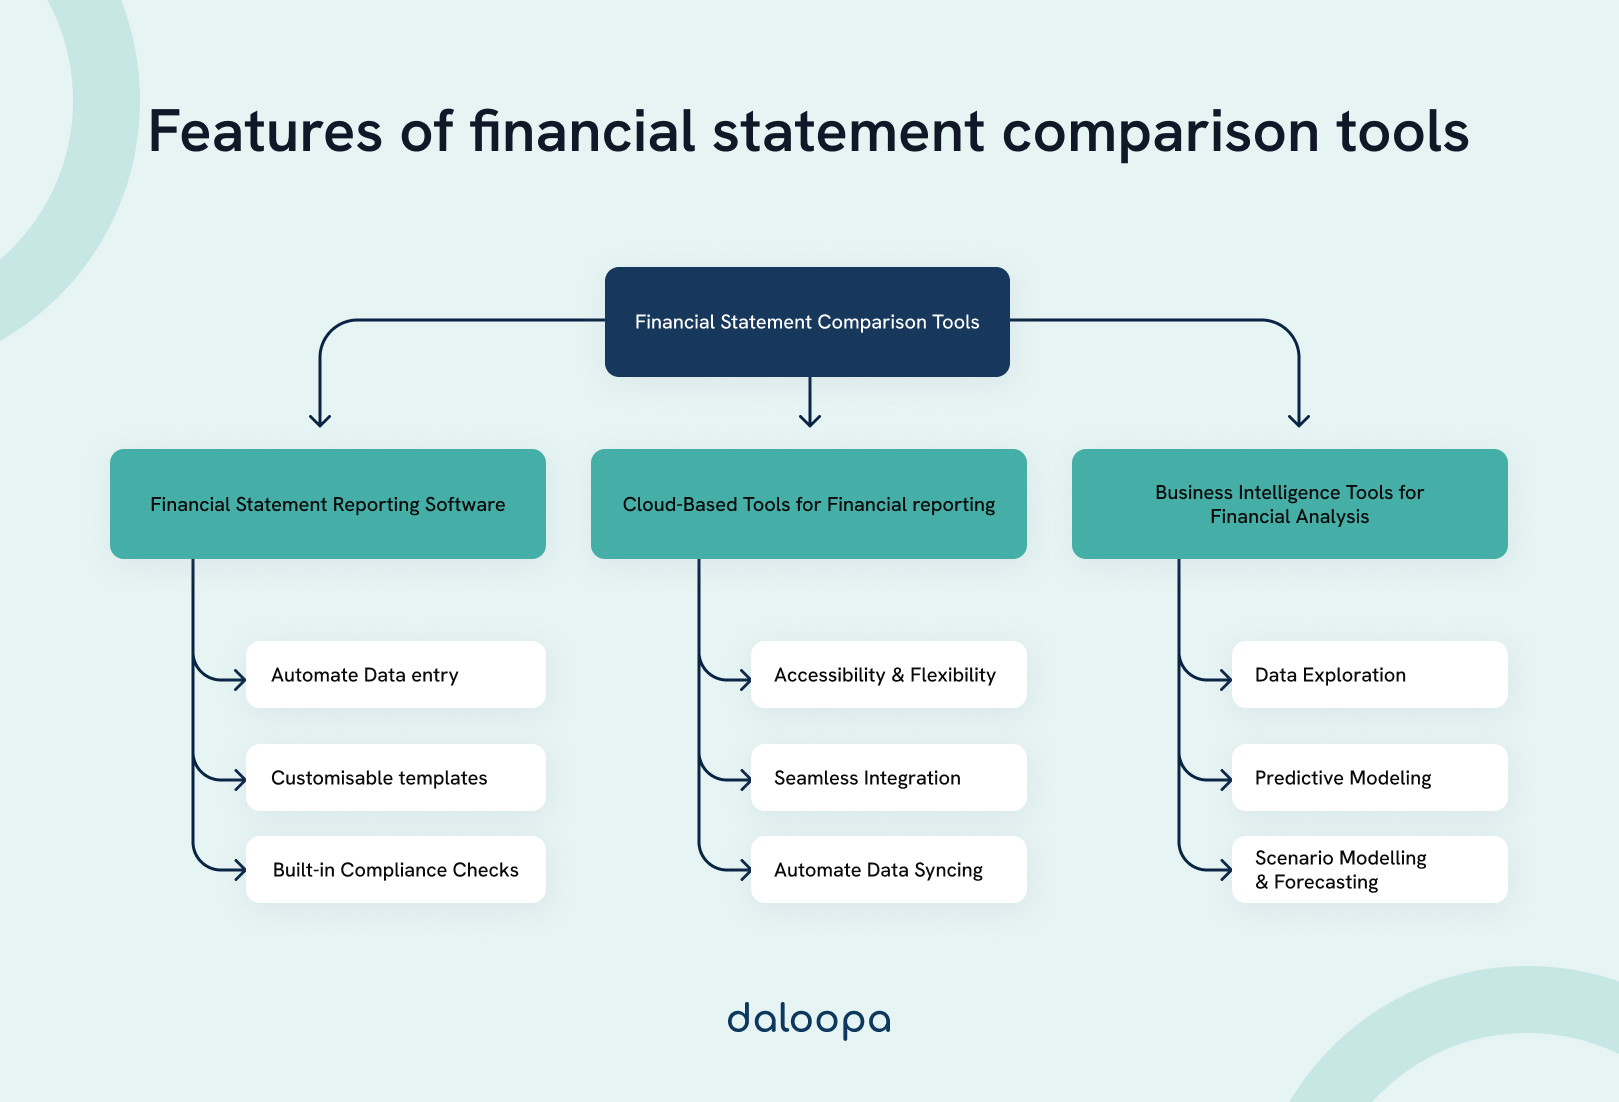
When choosing a financial statement analysis tool, it is essential to look for features that meet your specific needs. Key features may include automated data extraction, customizable reporting options, multi-dimensional analysis capabilities, intuitive user interface, and integration with accounting software. Additionally, ensure the tool provides comprehensive support and resources, as well as real-time updates to help you stay on top of financial trends.