How to Identify Undervalued Stocks Using Financial Ratios
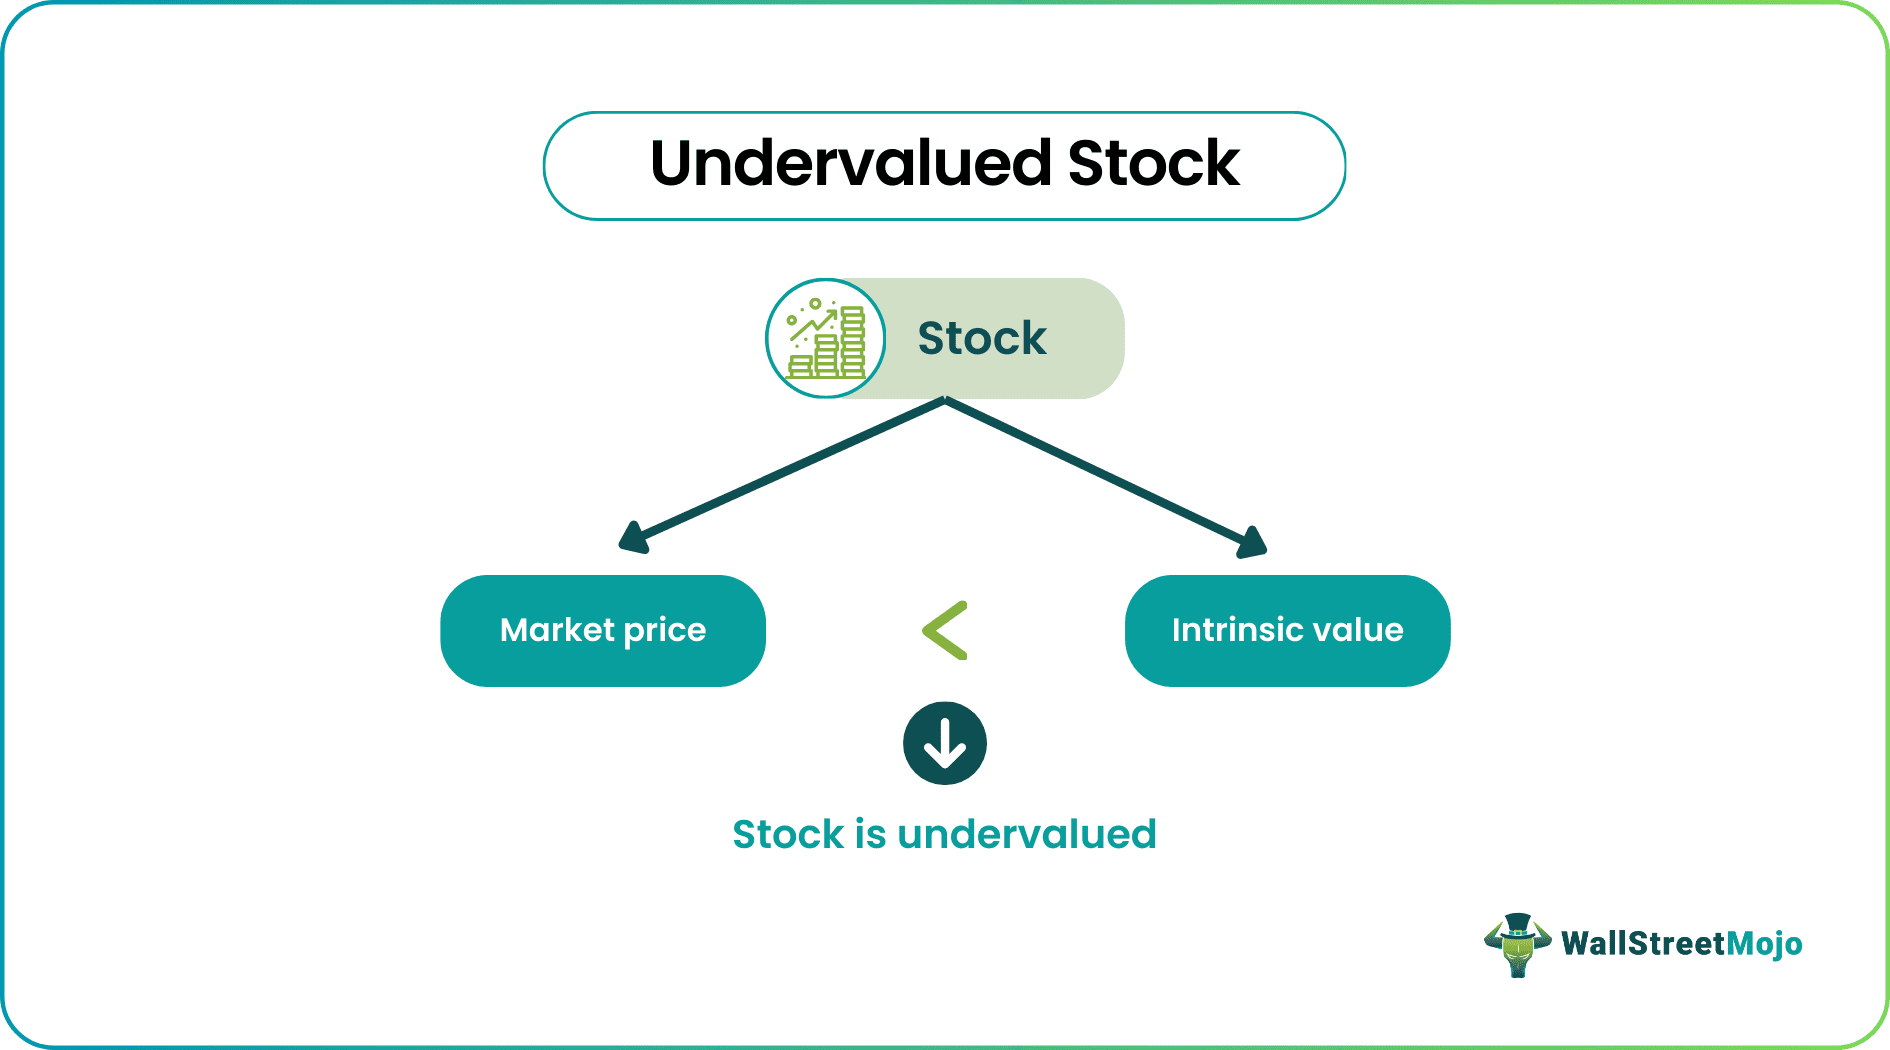
In the competitive landscape of stock investing, the ability to identify Undervalued Stocks can set astute investors apart from the crowd. Financial ratios serve as essential tools for unlocking the hidden value within a company’s performance, enabling you to make informed investment decisions. But with a plethora of ratios available, understanding which ones to focus on can be daunting. This blog post will guide you through the key financial ratios that can help you spot Undervalued Stocks, including in-depth interpretations of the price-to-earnings and price-to-book ratios, alongside the significance of dividend yield. By the end, you’ll be equipped with strategic insights to combine these ratios effectively and enhance your investment portfolio.
Understanding Financial Ratios and Their Importance in Stock Analysis
Financial ratios play a vital role in stock analysis, serving as essential tools for investors seeking to identify Undervalued Stocks. These ratios simplify complex data into practical insights, making it easier to gauge a company’s financial health. Here are key points to consider:
- Performance Measurement: Ratios evaluate how well a company operates relative to its peers.
- Comparative Analysis: They enable investors to compare different companies, facilitating informed decisions.
- Value Assessment: Ratios help determine if stocks are priced fairly in relation to their earnings and assets.
| Financial Ratio | Importance |
|---|---|
| Price-to-Earnings (P/E) | Indicates if a stock is over or undervalued based on earnings. |
| Price-to-Book (P/B) | Assesses a company’s valuation relative to its book value. |
| Dividend Yield | Shows potential returns and company stability through dividends. |
Understanding these ratios empowers investors to pinpoint Undervalued Stocks and ultimately make strategic investment choices. By incorporating financial ratios into stock analysis, you can unveil hidden opportunities in the market.

Key Financial Ratios for Identifying Undervalued Stocks
When it comes to pinpointing Undervalued Stocks, several financial ratios can guide investors. Understanding these ratios enhances decision-making and cultivates market insights. Here are some key ratios to consider:
| Financial Ratio | What It Indicates |
|---|---|
| Price-to-Earnings (P/E) | Evaluates a company’s current share price relative to its per-share earnings, helping assess valuation. |
| Price-to-Book (P/B) | Compares a company’s market value to its book value, highlighting whether the stock is overpriced or undervalued. |
| Dividend Yield | Measures annual dividends relative to the stock price, indicating potential earning returns and value perception. |
| Debt-to-Equity (D/E) | Assesses financial risk. A lower D/E ratio can suggest a more stable, undervalued company. |
| Return on Equity (ROE) | Reflects a company’s efficiency in generating profit from shareholders’ equity, hinting at long-term value. |
Utilizing these financial ratios allows investors to filter potential Undervalued Stocks, revealing opportunities that others might overlook. By integrating these metrics into your analysis, you can make more informed investment choices.
Interpreting Price-to-Earnings Ratio in the Context of Undervalued Stocks
The Price-to-Earnings (P/E) Ratio is a crucial financial metric for investors looking to identify undervalued stocks. This ratio provides insight into how much investors are willing to pay for a dollar of earnings. A lower P/E ratio may suggest that a stock is undervalued compared to its peers, indicating potential buying opportunities.
Key Comparisons:
| Stock Name | P/E Ratio | Industry Average P/E |
|---|---|---|
| Stock A | 12 | 15 |
| Stock B | 10 | 15 |
| Stock C | 18 | 15 |
In this table, both Stock A and Stock B have lower P/E ratios than the industry average, suggesting they may be undervalued stocks. However, it’s essential to consider other factors, such as industry trends and company growth prospects, to make a well-informed decision. Using the P/E ratio in conjunction with a thorough analysis of financial health can maximize your chances of uncovering truly undervalued opportunities.
Utilizing Price-to-Book Ratio to Spot Undervalued Stocks
The Price-to-Book (P/B) ratio is a crucial metric for spotting undervalued stocks. It compares a company’s market value to its book value, revealing whether a stock is priced appropriately based on its assets. Here’s how to effectively utilize the P/B ratio:
- Formula:
- P/B Ratio = Market Price per Share / Book Value per Share
- Key Interpretations:
- P/B < 1: Indicates that the stock may be undervalued, potentially presenting a buying opportunity.
- P/B = 1: Suggests that the stock is fairly valued.
- P/B > 1: Can signify overvaluation; investors are paying more for the stock than its book assets.
| P/B Ratio Range | Interpretation | Investment Outlook |
|---|---|---|
| Less than 1 | Possible undervaluation | Buy signal |
| Equal to 1 | Fairly valued | Hold signal |
| Greater than 1 | Potential overvaluation | Caution advised |
In summary, by analyzing the P/B ratio alongside other financial metrics, investors can uncover undervalued stocks worth consideration.
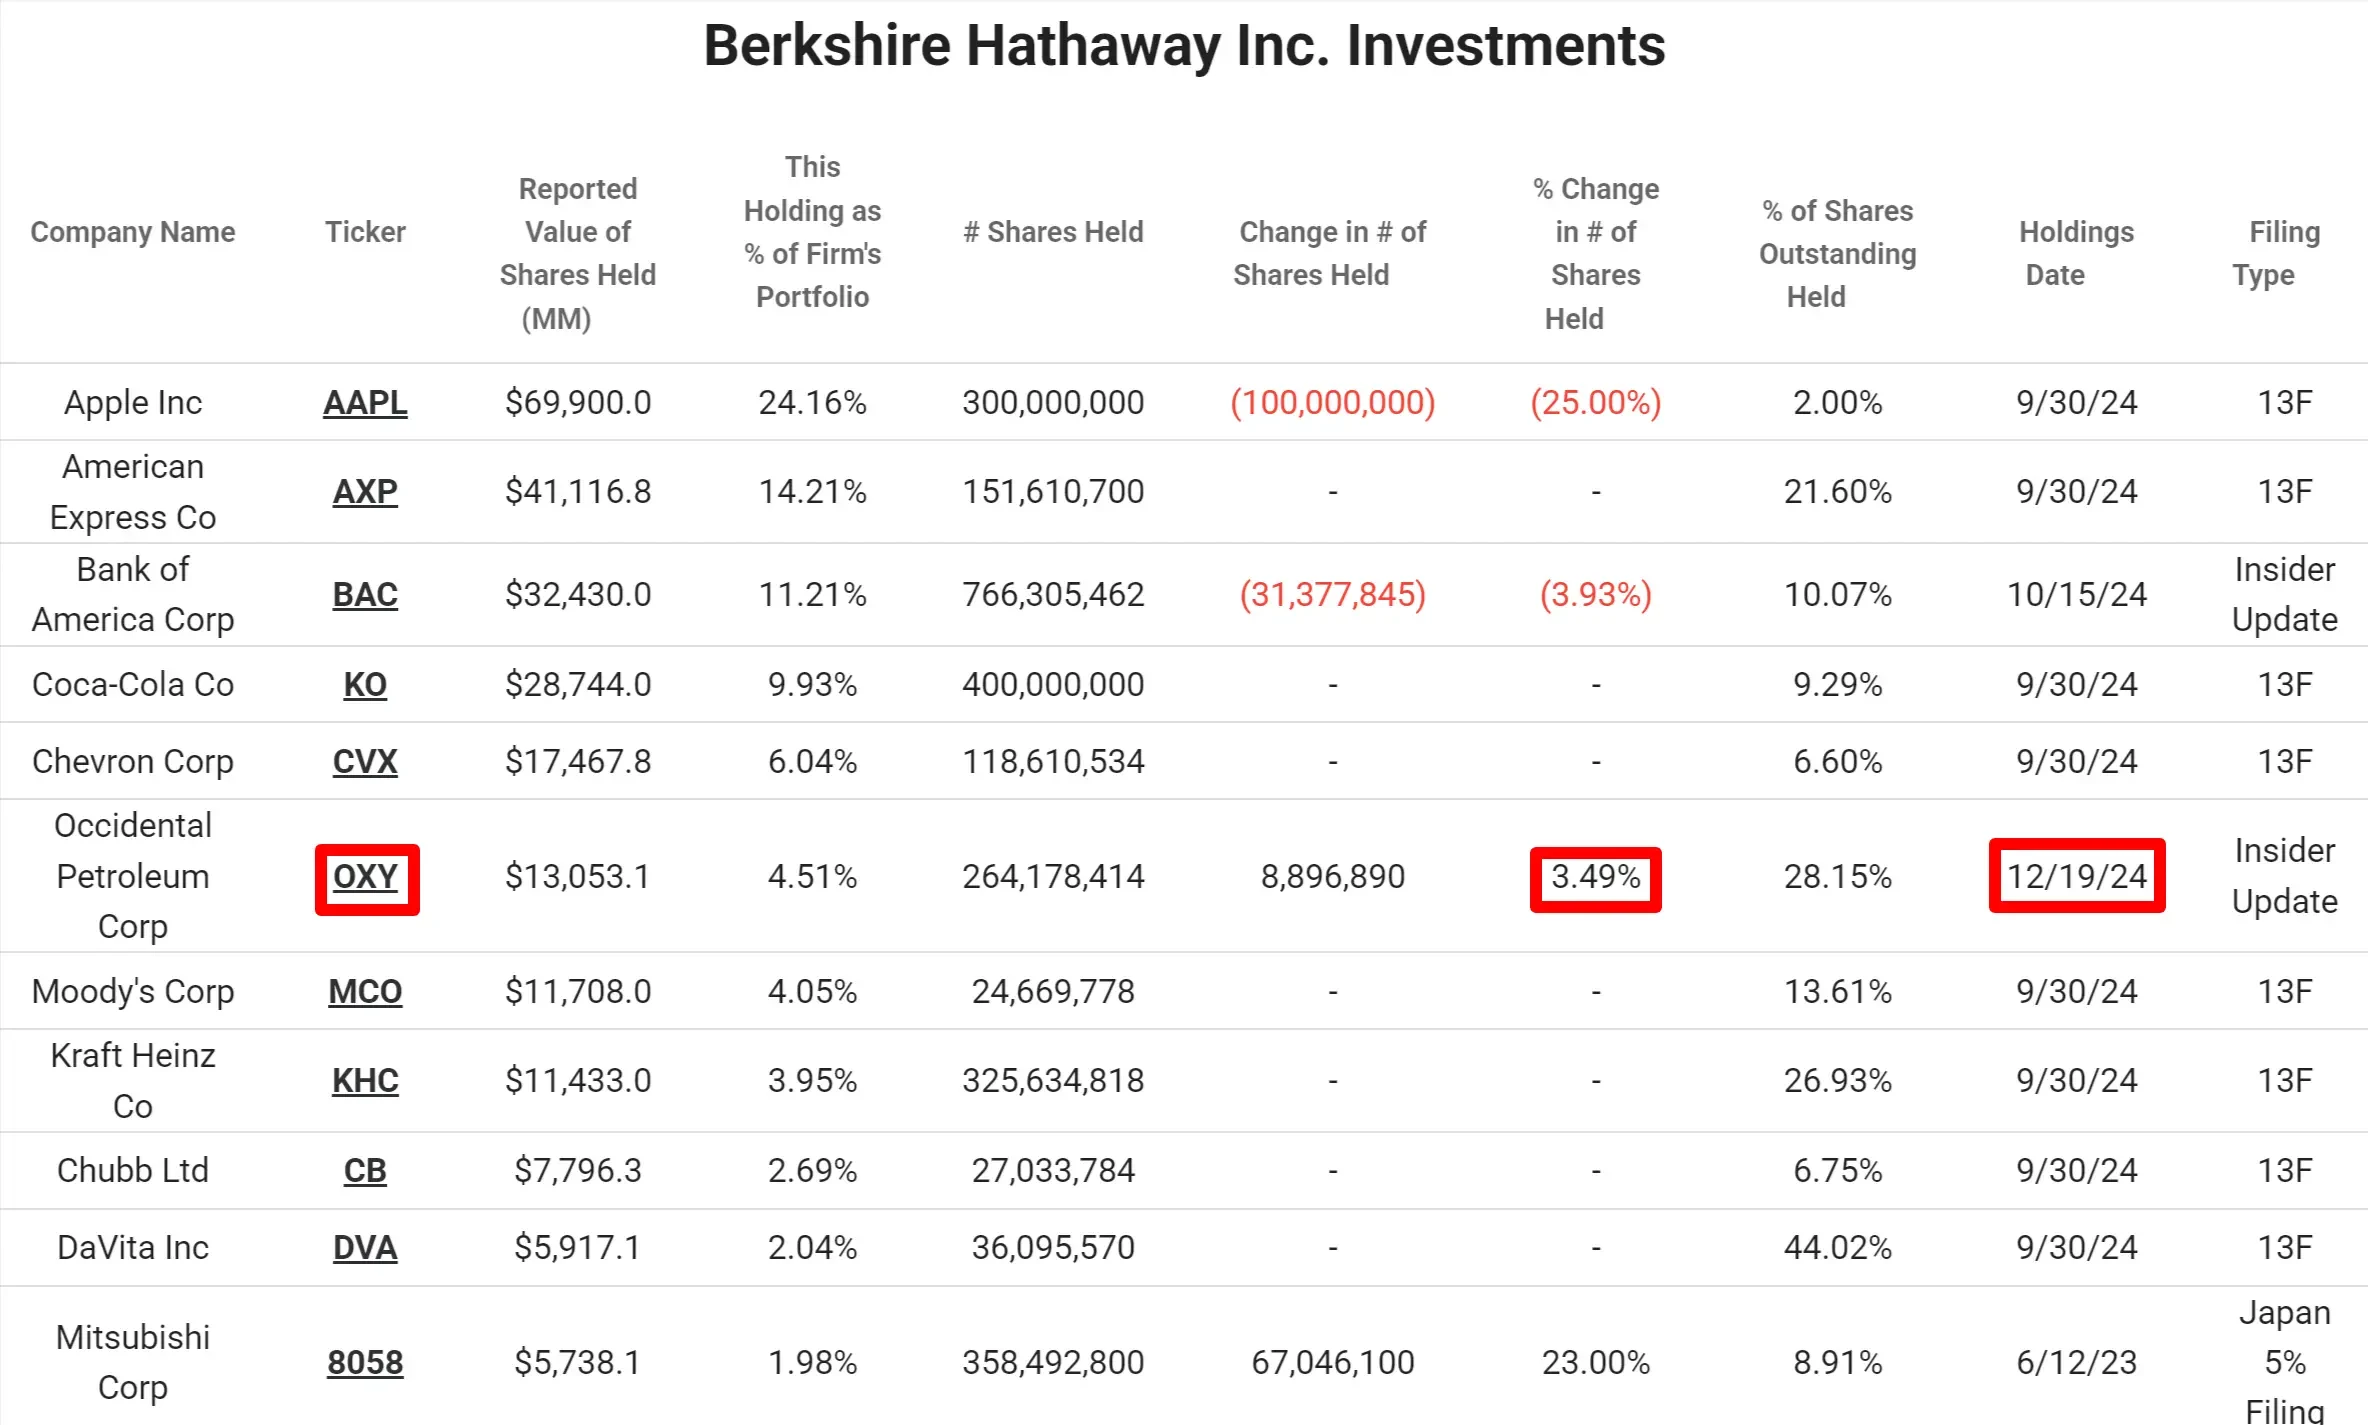
The Role of Dividend Yield in Assessing Undervalued Stocks
Dividend yield is a crucial metric in evaluating Undervalued Stocks. It represents the annual dividends paid by a company relative to its share price, offering insights into its financial health and investment potential. Here’s why dividend yield matters:
| Key Aspect | Explanation |
|---|---|
| Attractiveness | Higher yields can signal that a stock is undervalued compared to peers. |
| Stability Indicator | Consistent dividend payments suggest reliability and financial strength. |
| Income Generation | Investors seeking passive income may prioritize dividend yield over growth. |
| Market Sentiment | A declining stock price with stable dividends might indicate an opportunity. |
When analyzing Undervalued Stocks, compare dividend yields within the same industry to identify potential bargains. A robust dividend yield, combined with low price ratios, can highlight stocks worth considering for your portfolio.
Strategies for Combining Financial Ratios to Identify Undervalued Stocks
Successfully identifying Undervalued Stocks often requires a multifaceted approach that leverages various financial ratios. Combining Ratios can yield more insightful results than relying on a single metric. For instance, the Price-to-Earnings (P/E) ratio can be examined alongside the Price-to-Book (P/B) ratio. When a stock has a low P/E and an equally low P/B, it may indicate that the stock is not only undervalued but also presents a greater opportunity for growth.
Another effective strategy is to analyze the Dividend Yield in conjunction with these ratios. Stocks with a high dividend yield relative to their P/E and P/B ratios may signal a promising investment as they offer both income and potential capital appreciation.
| Financial Metric | P/E Ratio | P/B Ratio | Dividend Yield |
|---|---|---|---|
| Stock A | 10 | 1.5 | 4% |
| Stock B | 15 | 2.0 | 3% |
| Stock C | 8 | 1.0 | 5% |
In this table, Stock C showcases the lowest P/E and P/B ratios while offering the highest dividend yield, making it a prime candidate for being undervalued. Implementing these strategies with a comprehensive analysis of trends helps investors make informed decisions.
Frequently Asked Questions
What are financial ratios, and why are they important in identifying undervalued stocks?
Financial ratios are quantitative metrics used to evaluate a company’s financial status and performance. They provide insights into aspects like profitability, liquidity, and solvency. Ratios such as Price-to-Earnings (P/E) and Price-to-Book (P/B) are crucial in identifying undervalued stocks, as they help investors compare the company’s stock price to its intrinsic value. By analyzing these ratios, investors can find potential opportunities where stocks are priced lower than their actual worth.
Which financial ratios should I focus on when identifying undervalued stocks?
When identifying undervalued stocks, several key financial ratios come into play. The Price-to-Earnings (P/E) ratio helps assess if a stock is over or underpriced relative to its earnings. The Price-to-Book (P/B) ratio indicates whether a stock is trading below its book value. Additionally, the Dividend Yield is important for investors looking for income, as it shows the percentage of a company’s earnings distributed to shareholders. Focusing on these ratios can help unveil stocks that are undervalued by the market.
How can I use the P/E ratio to find undervalued stocks?
The Price-to-Earnings (P/E) ratio is calculated by dividing a company’s current share price by its earnings per share (EPS). A lower P/E ratio compared to industry averages may indicate that a stock is undervalued, suggesting that investors might be overlooking the company’s earnings potential. However, it’s essential to consider the context—investors should look for patterns and trends within the ratio over time and compare it to historical averages, as well as industry peers, for a comprehensive analysis.
What is the significance of comparing a stock’s P/B ratio to its competitors?
The Price-to-Book (P/B) ratio compares a company’s market capitalization to its book value. By evaluating and comparing a stock’s P/B ratio against its competitors, investors can identify potential undervaluation. A P/B ratio below 1 suggests that a stock is trading for less than its net asset value, which may attract value investors. However, it is essential to consider industry norms, as different sectors may have different average P/B ratios, making context crucial in interpreting the results.